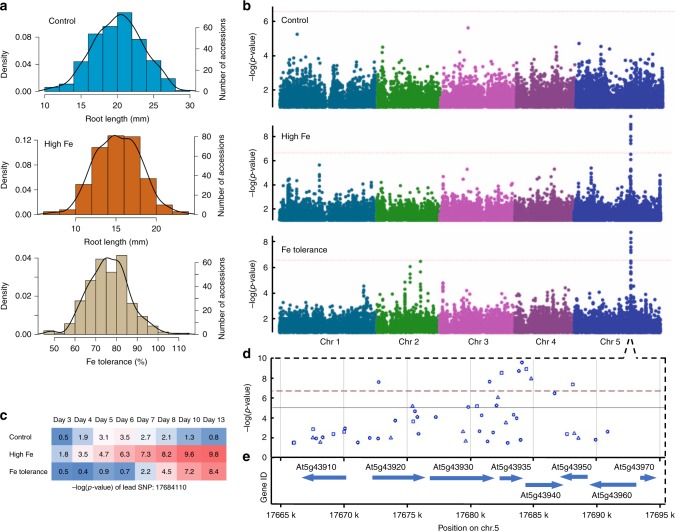
Fig. 1.
GWAS identifies GSNOR as associated with the root growth response to high Fe. a Distributions of root length and Fe tolerance index in 319 accessions at day 10. b Manhattan plots of GWAS using traits shown in a. Different colors indicate five chromosomes. The horizontal dashed lines indicated the thresholds of significance. c A heatmap of -log(p-value) of lead SNP identified at high Fe in b over the course of time. d, e Regional plots of the significant SNPs d and genes e identified at high Fe in b. GSNOR is encoded by At5g43940. Circle, triangle, and square denote the SNP to cause intergenic, non-synonymous_coding, and synonymous_coding changes, respectively. The source data of Fig. 1a are provided in a Source Data file

