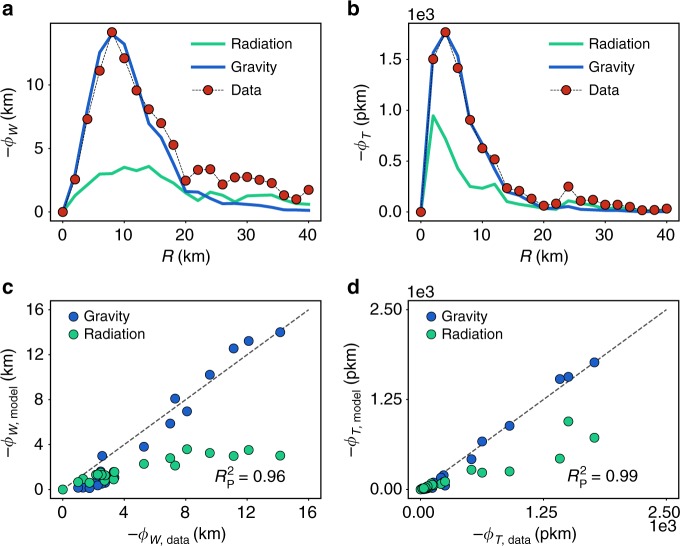
Fig. 4.
Model comparison. Red dots represent the fluxes measured with the empirical vector field. In the blue solid line, we show the predicted fluxes with the gravity model with an exponential deterrence function while the green curve corresponds to the radiation results. Results for London of a ΦW with a comparison between the gravity model and the data of and b for the flux of T with . In both cases, d0 = 9.4 km. c, d are correlation plots between the gravity and the empirical flux. The results for the radiation are systematically below the diagonal. The units for ΦW are in kilometers (km), while those of ΦT are in persons multiplied by kilometer (pkm)

