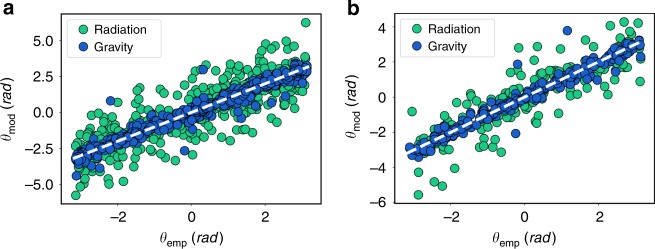
Fig. 5.
Angle comparison. Scatter plot of the angle of in each cell i respect to the positive horizontal axis measured from the data Θemp and compared with the models prediction Θmod. The gray dashed lines correspond to the diagonals. The domain of the empirical angles is (−π, π], while for Θmod we seek to minimize the distance to the empirical value by considering the original angle and its shifts in ±2π. In a, the comparison is performed in London and in b it is for the Paris case. R-squares for London are and . For Paris, they are and

