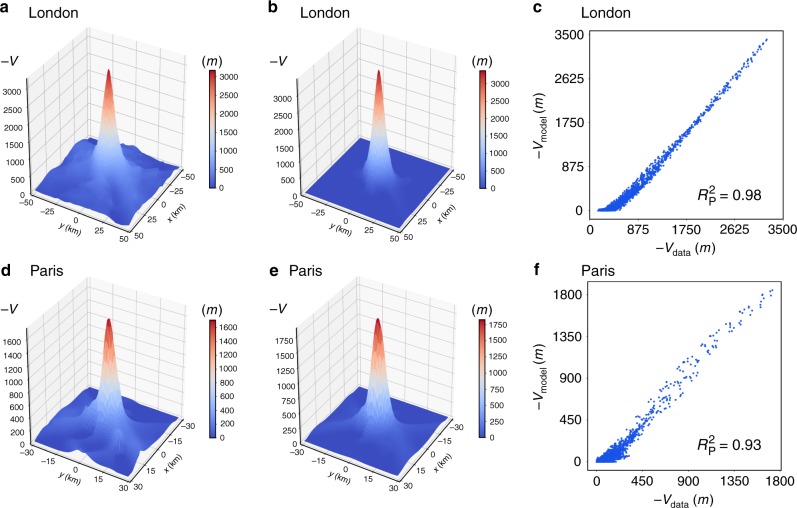
Fig. 6.
City potentials. a–c London. d–f Paris. a, d The empirical potential results clearly peaked in the city center, where in overall the density of inhabitants is high. The equilibrium point of the mobility is located at the minimum of the potential. b, e The gravity model predicted potential peaks also at the city center in agreement with the empirical results. c, f Scatter plots comparing gravity model with exponential deterrence function predictions and empirical values of the potential, which show high correlation

