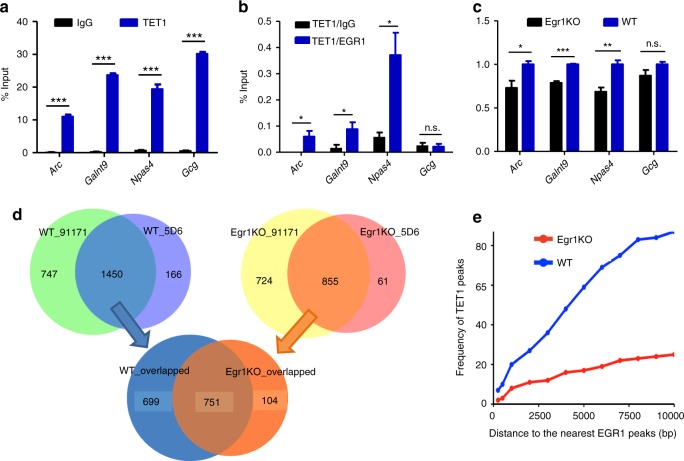
Fig. 3.
EGR1 recruits TET1 to its target sites. a TET1 ChIP-qPCR assay in wild-type mouse frontal cortices. b Sequential ChIP-qPCR assay in wild-type mouse frontal cortices. The first antibody used was anti-TET1; the secondary antibody used was anti-EGR1 and normal rabbit IgG. Gcg locus serves as negative control for EGR1 binding. c ChIP-qPCR assay in frontal cortices of Egr1KO and wild-type mice. TET1 enrichment is normalized to the enrichment in WT. P-values were calculated with t-test, *P < 0.05, **P < 0.01, ***P < 0.001. n.s., not significant. Error bars ± standard deviation (s.d.) from three technical replicates. d Venn diagrams show the overlapped TET1 peaks generated with two distinct antibodies (91171 and 5D6, Active Motif) or from WT and Egr1KO frontal cortices. e The distribution of TET1 peaks relatively to their nearest EGR1 peaks. The distance of TET1 peak to its nearest EGR1 peak refers to the number of nucleotides between the centers of two peaks

