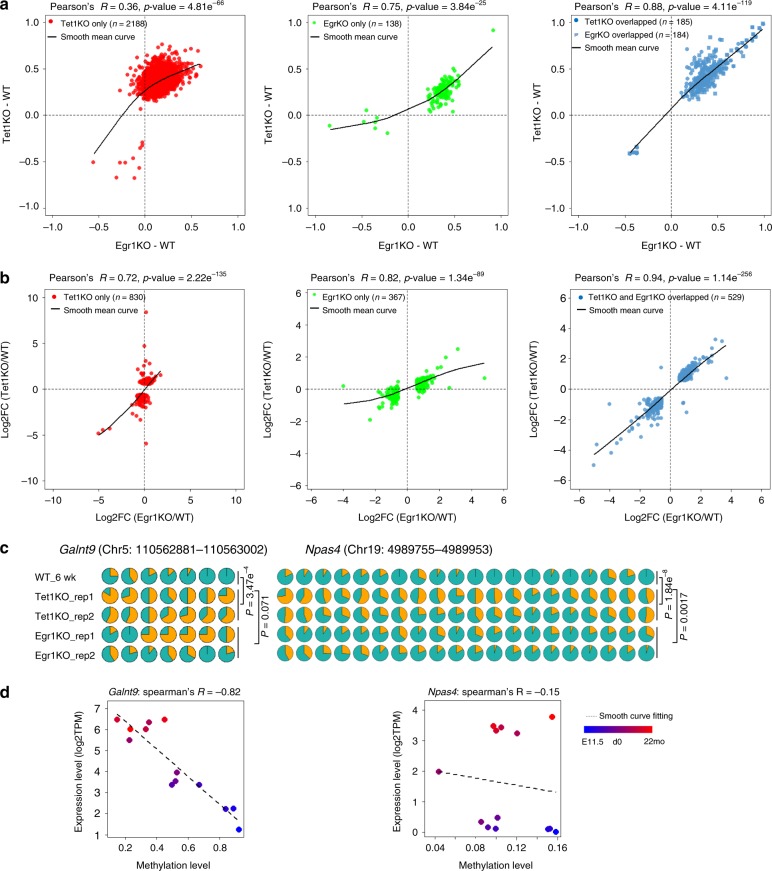
Fig. 5.
Correlations of DNA methylation and gene expression profiles between Egr1KO and Tet1KO frontal cortices. Methylation correlations (a) and gene expression correlations (b) between Egr1KO and Tet1KO mice. c Aberrant DNA methylation on Galnt9 and Npas4 loci. Each CpG is represented by a circle; yellow in circles indicates the percentage of methylation in each CpG site. The statistical significance of methylation differences between Egr1/Tet1KO and WT mice was evaluated with the Wilcoxon rank-sum test. d The correlations between DNA methylation levels of Galnt9, Npas4 loci and corresponding gene expression during brain development from embryonic day 11.5 (E11.5) (denoted in blue color) to 22 months (22 mo) (denoted in red color)

