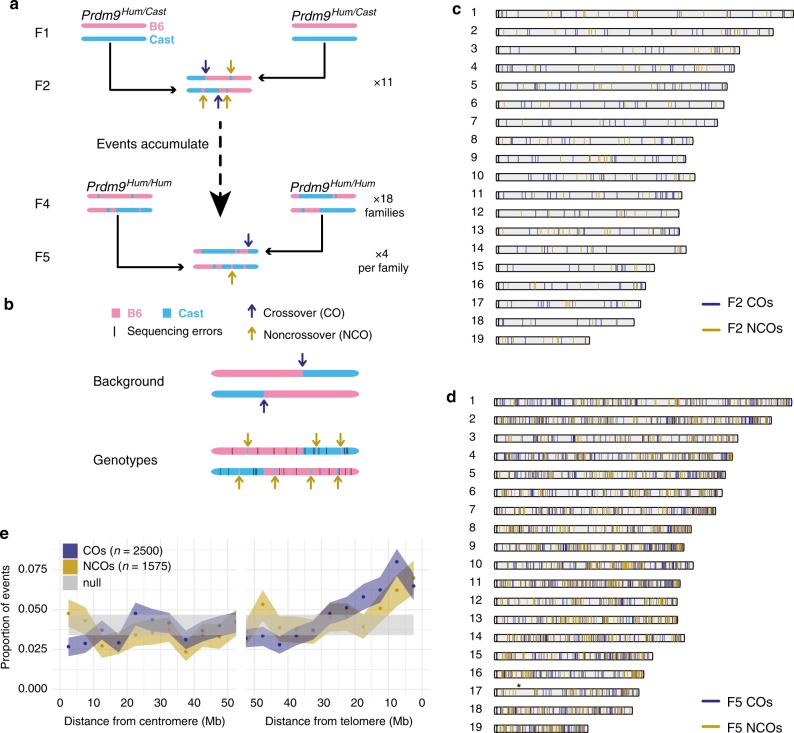
Fig. 1.
Study design and properties of CO and NCO events. a Study design. Arrows indicate locations of de novo CO and NCO events. 11 F2 mice, 36 F4 mice, and 72 F5 mice were sequenced. b Detection of NCOs by comparing observed genotypes and background. c, d Distribution of identified CO breakpoints and NCOs across autosomes from F2 (c) and F5 (d) animals. d Includes both de novo and distinct inherited events from the F5 mice. Asterisk on Chr17 indicates the position of the Prdm9 gene, which was selected to be homozygous and may show lower power to detect nearby F5 events. e Binning all events by their distance to the centromere or telomere (x-axis); shaded regions represent 90% bootstrap CIs. “Null” represents the results of scrambling NCO positions uniformly across each chromosome

