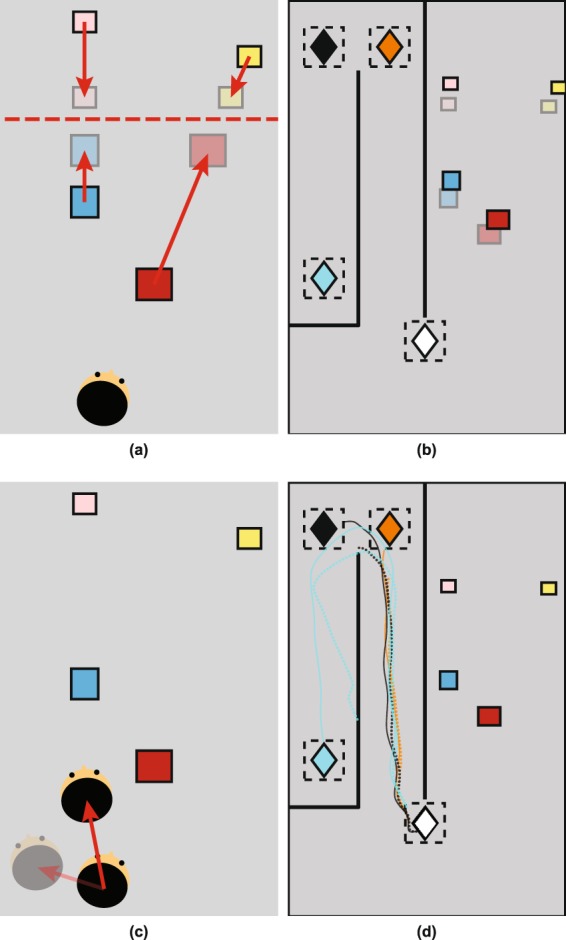
Figure 5.

Schematic of abathic-distance-distortion and noisy-path-integration models (a) The abathic distance is shown by the dashed line and arrows show contraction towards this plane. (b) Example of target box locations shifted under the abathic distance model (opaque rectangles show true box positions). (c) Opaque head shows the observer’s true translation, the faded head shows the assumed translation under the noisy-path-integration model. Free parameters control errors in the estimate of translation and orientation on every step. (d) Solid lines show the walking paths of a participant, dotted lines show the misestimated walking path using this model.
