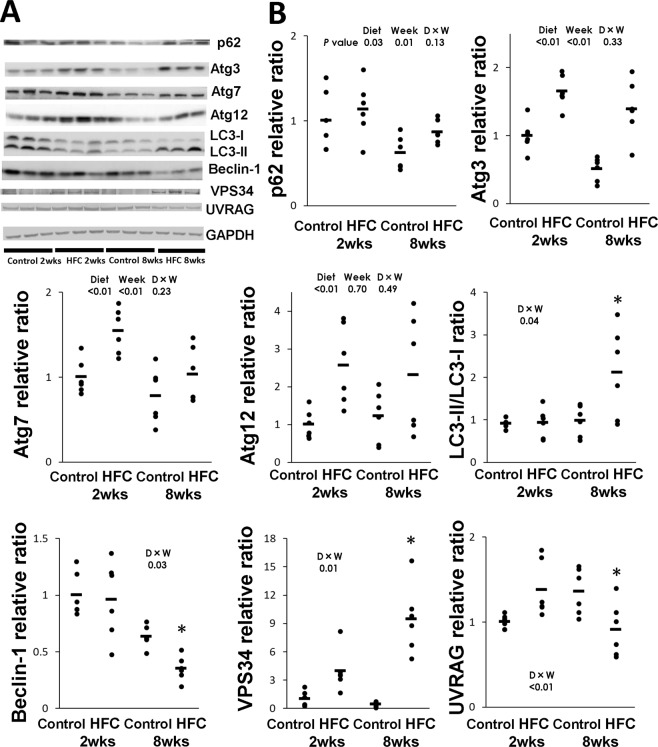
Figure 2.
(A) Representative Western blot images of p62 and autophagy-related proteins (Atg) 3, 7 and 12, and microtubule-associated protein 1 light chain 3 (LC3), beclin-1, class III phosphatidylinositol 3-kinase (VPS34) and UV radiation resistance-associated gene protein (UVRAG). Samples were obtained from SHRSP5/Dmcr rats fed control and HFC diets for 2 and 8 weeks. (B) Data are presented as means (bar) and dot plots for individual data. Glyceraldehyde-3-phosphate dehydrogenase (GAPDH) was used as a loading control. Wide-length blots/gel image are presented in Supplementary information. Data was analysed by two-way analysis of variance between diet and feeding duration (week). P values of diet, and week, D × W (diet × week interaction effect) were expressed within each graph. *Significant difference between HFC diet and control-diet groups, P < 0.05.

