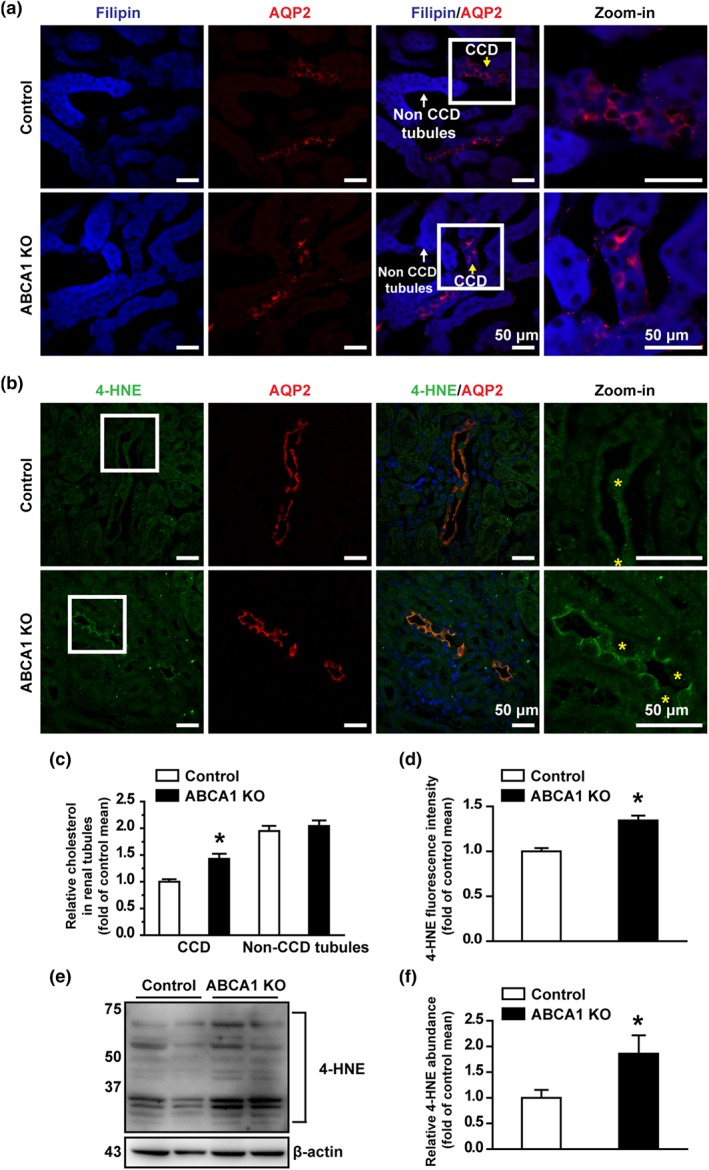
Figure 5.

ABCA1 KO increases intracellular cholesterol in the mouse CCD. (a) Confocal microscopy images of cholesterol levels (blue, labelled with filipin) either in CCD or in other tubules from control and ABCA1 KO mice. Scale bars: 50 μm. (b) Confocal microscopy images of 4‐HNE levels (green) from control and ABCA1 KO mice. Yellow stars indicate the intercalated cells cell. Scale bars: 50 μm. (c) Summary data of fluorescence intensity either in CCD or in other tubules from control and ABCA1 KO mice. Each experiment was repeated three times in six mice; 20 images were used for analysis. *P < .05, significantly different from control; Student's two‐tailed t‐test. (d) Summary data of fluorescence intensity from control and ABCA1 KO mice. Each experiment was repeated three times in six mice; 20 images were used for analysis. *P < .05, significantly different from control; Student's two‐tailed t‐test. (e) Western blot of kidney cortex lysates from control and ABCA1 KO mice, using antibodies against 4‐HNE and β‐actin as a loading control. (f) Summary data of Western blots, showing 4‐HNE expression in kidney cortex from control and ABCA1 KO mice; n = 6 in each group. *P < .05, significantly different from control; Student's two‐tailed t‐test)
