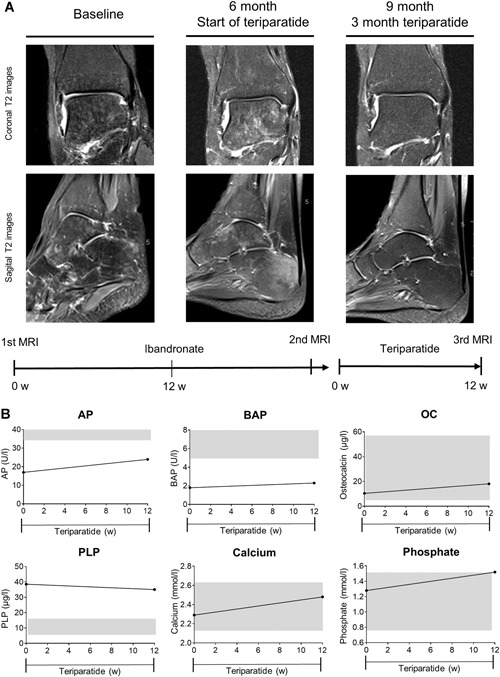
Figure 3.

Case 1 (A) Coronal T2 (top) and sagittal T2 (bottom) MR images of the right foot at baseline, after 6 months of bisphosphonate therapy, and at follow‐up after 3 months of teriparatide therapy. (B) Biochemical response with levels of alkaline phosphatase (ALP), bone‐specific alkaline phosphatase (BAP), osteocalcin (OC), pyridoxal 5’‐phosphate (PLP), calcium, and phosphate after cessation of treatment with ibandronate and onset of therapy with teriparatide. Grey areas represent reference range. MRI showed improvement and the laboratory report displayed a positive biochemical response.
