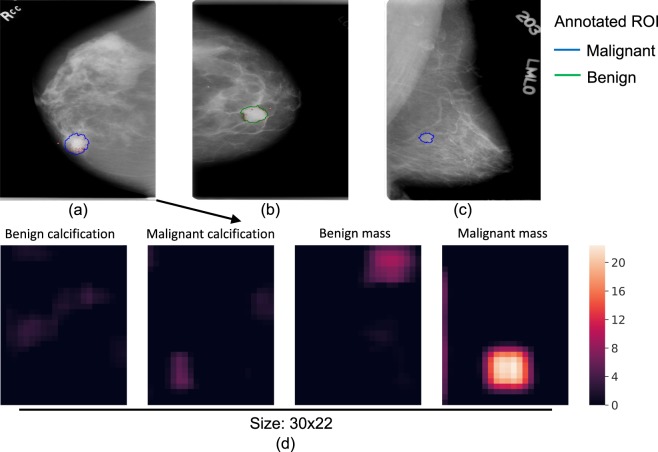
Figure 4.
Saliency maps of TP (a), FP (b) and FN (c) image classifications. The outlines represent the regions of interest annotated by the radiologist, and biopsy-confirmed to contain either malignant (blue) or benign (green) tissue. The red dots represent the gradients of the input image with respect to the cancer class output. The gradients were rescaled to be within [0, 1] and a low cutoff of 0.06 was used to remove background noise. Heatmaps (d) of the four non-background classes for input image (a). The colors of the heatmaps represent the activation values after ReLU. This figure is best viewed in color.

