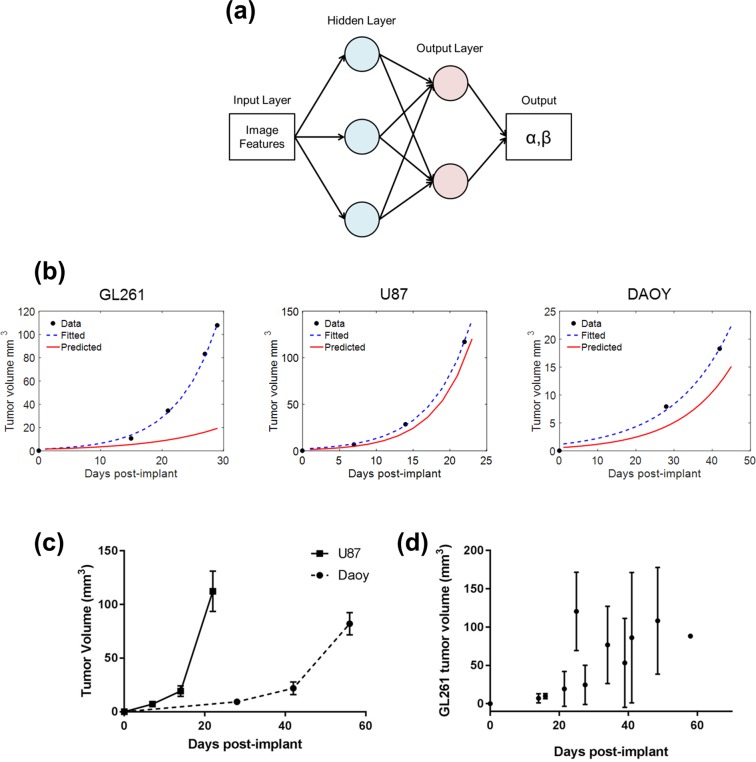
Figure 4.
Prediction of tumor growth curve. (a) Two-layer feedforward network with a sigmoid transfer function in the hidden layer and linear transfer function in the output layer. Tumor growth is different between the different tumor types. (b) Growth curve of the three different tumor type with the experimental data, the fitted exponential growth model and the predicted growth curve from the neural network. (c,d) Growth curve of each tumor type. Data is shown as mean ± standard deviation.

