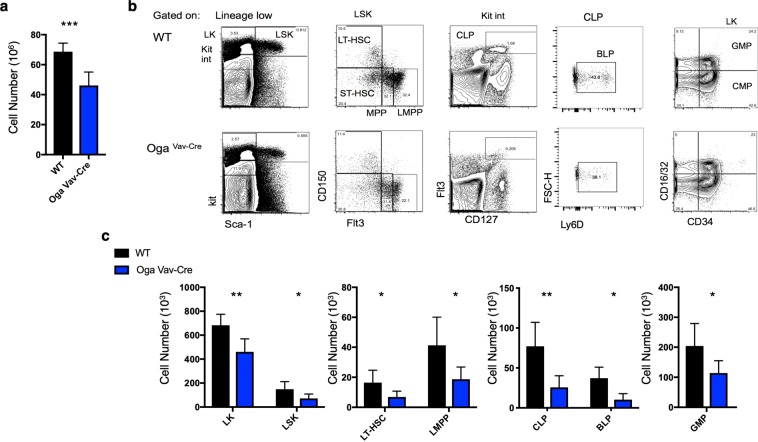
Figure 2.
Reduced bone marrow progenitor populations in OgaVav-Cre mice. (a) Quantitation of total number of bone marrow cells from the indicated genotype. (b) Representative flow cytometric analysis, with boxes depicting gating, of long-term hematopoietic stem cells (LT-HSC, Lin−Sca1+Kit+ CD150+Flt3−), short-term hematopoietic stem cells (ST-HSC, Lin−Sca1+Kit+ CD150−Flt3−), multipotent progenitors (MPP, Lin−Sca1+Kit+ CD150−Flt3+) and lymphoid primed MPP (LMPP, Lin−Sca1+Kit+ CD150−Flt3+), common lymphoid progenitors (CLP, Lin−KitintFlt3+CD127+), B cell-biased lymphoid progenitors (BLP, Lin−KitintFlt3+CD127+Ly6d+) granulocyte/macrophage progenitors (GMP, Lin−Kit+Sca−CD16/32+CD34+) and common myeloid progenitors (CMP, Lin−Kit+Sca−CD16/32−CD34+). (c) Graphs depicting the absolute numbers of the indicated cell populations for the indicated genotype. Black bars represent wildtype and blue bars represent OgaVav-Cre. N = 4–6, error bars represent standard deviation, *p < 0.05, **p < 0.01 as determined by t-test.

