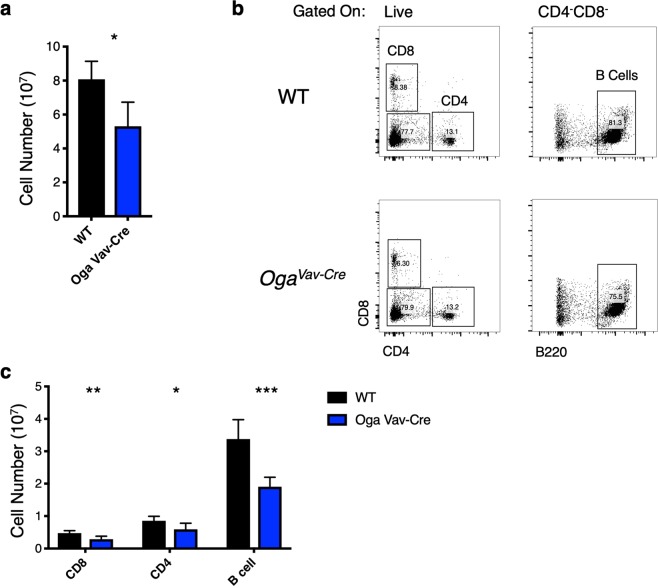
Figure 4.
Reduced peripheral lymphoid populations in OgaVav-Cre mice. (a) Quantitation of total number of splenocytes from the indicated genotype. (b) Representative flow cytometric analysis of CD8+, CD4+ T cells, and B cell (CD4−CD8−B220+) populations from mouse spleen from the indicated genotype. (c) Graph depicting the absolute numbers of the indicated cell populations for the indicated genotype. Black bars represent wildtype and blue bars represent OgaVav-Cre. N = 6, error bars represent standard deviation, *p < 0.05, **p < 0.01, ***P < 0.001, as determined by t-test.

