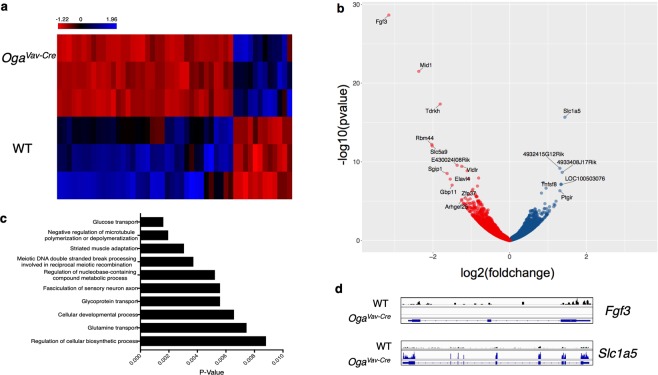
Figure 7.
Transcriptional deregulation of genes involved in stem cell function. RNA-Seq was performed on sorted LSK cells from 3 OgaVav-Cre and 3 wildtype mice. Genomatix analysis called 41 significantly downregulated and 12 significantly upregulated genes represented as a heatmap (using RPKMs) (a) and volcano plot (b). (b) Oga was excluded from volcano plot for scale, genes with a log2(foldchange) ± >1.25 and p < 0.005 are labelled. (c) Top 10 enriched gene ontology terms (GO) among the deregulated genes as determined by Genomatix. (d) Representative IGV view of the most significantly down regulated (Fgf3) and upregulated (Slc1a5) genes.

