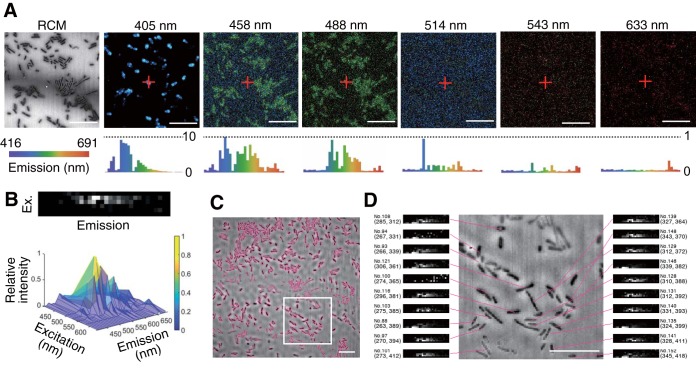
FIG 1.
(A) Reflection confocal microscopy (RCM) and confocal microspectroscopy images (labeled by their excitation wavelengths) of P. putida KT2440. Confocal microspectroscopy images are represented as “true-color” images (i.e., the color in the image corresponds to the emission wavelength). Confocal reflection microscopy images are represented as grayscale images that reflect the relative signal intensity. Histograms indicate relative fluorescence intensity spectra in the range of 416 to 691 nm, for the pixel marked by a red cross in the microscopy images. Each bin of the histogram represents a spectral window with a width of 8 nm. Cells appear darker than the background in the confocal reflection microscopy image due to the lower refraction index than for the coverslip. (B) Reconstructed single-cell hyperspectrum presented as a surface plot and as a 2D grayscale image, with six rows for the six excitation wavelengths and a column for each of the 32 bins of the emission spectrum. (C) Visual representation of cell contour recognition by the image analysis routine. A bright-red border indicates the cell contour detected based on intensity gradients. (D) Visual representation of the link between each cell and its single-cell hyperspectrum. The relative xy position (pixel counts from the top left corner in a 500- by 500-pixel image) of a cell center of mass and an identification number assigned to each cell are shown beside each hyperspectrum. The images show the 2D projection of z-stack images. Bars, 10 μm.

