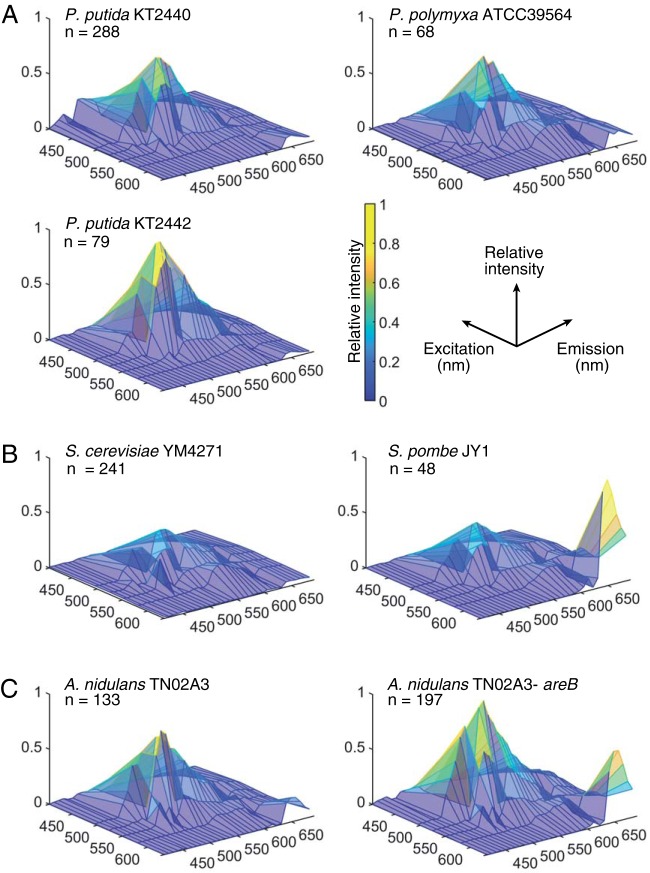
FIG 2.
Hyperspectra of bacterial, fungal, and yeast strains. Hyperspectra are presented as surface plots, where x, y, and z axes represent excitation wavelengths, emission wavelengths, and averaged relative fluorescence intensities (color scale), respectively. (A) P. putida KT2440, P. putida KT2442, and P. polymyxa ATCC 39564; (B) the budding yeast S. cerevisiae YM4271 and the fission yeast S. pombe JY1; (C) wild-type and nitrogen regulator mutant strains of the filamentous fungus A. nidulans TN02A3. Panels show the hyperspectra averaged over each population of size n.

