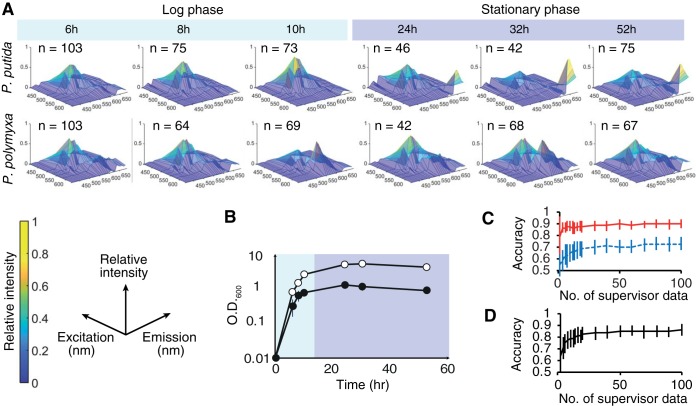
FIG 5.
(A) Hyperspectra of P. putida KT2440 and P. polymyxa ATCC 39564 at various growth stages. Panels show the hyperspectra averaged over each population of size n. (B) Time course of the optical density at 600 nm (O.D.600) for P. polymyxa ATCC 39564 (open circles) and P. putida KT2440 (filled circles). Growth data are the averages of results from triplicate experiments. (C) Classification accuracy between the log and stationary phases of P. polymyxa ATCC 39564 (blue) and P. putida KT2440 (red) cells by the SVM with various numbers of supervisor data. (D) Two-class classification accuracy for P. polymyxa ATCC 39564 and P. putida KT2440 cells by the SVM with various numbers of supervisor data, with all growth stages included. Bars show the standard deviations.

