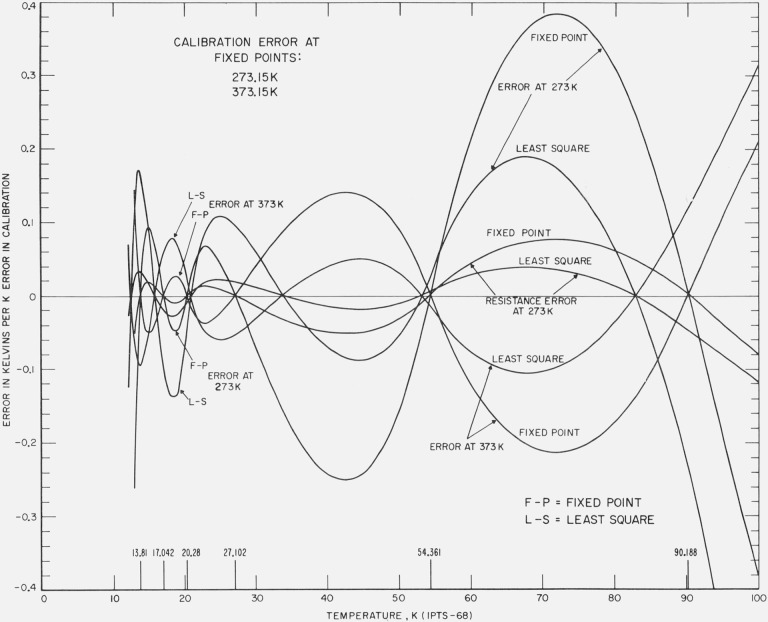
Figure 6. The effect of errors in the realization of the fixed points above 0 °C on the calibration of a platinum resistance thermometer in the region 13 K to 90 K.
The errors introduced in the calibration when the least squares treatment is employed is compared with those of the fixed point treatment of the same data. The effects of errors equivalent to unit positive temperature in the realization of the TP and of the NBP of water are each plotted. The resulting errors are also shown when an error in R(0 °C) equivalent to a unit positive temperature is made but no error in α is made.

