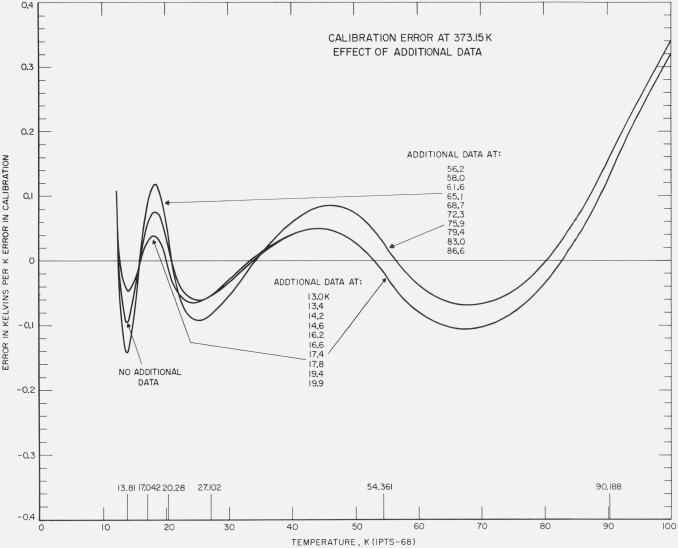
Figure 7. The effect of three times more data in the region 13 to 20 K and the effect of three times more data in the region 54 K to 90 K on the results of least squares treatment of the calibration data with an error equivalent to unit positive temperature at the NBP of water.
The plot gives the deviations of the values of temperatures of the calibration with error from those of the calibration without error.

