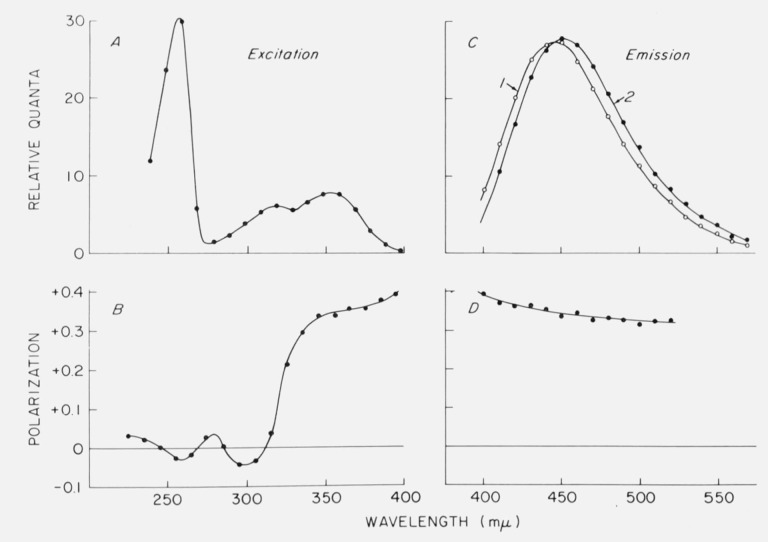
Figure 3.
Fluorescence and polarization spectra of quinine in glycerol containing 0.1 N H2SO4 at 8 °C A. Excitation spectrum. B. Fluorescence polarization spectrum obtained with varied exciting wavelength and emission monochromator set at 450 nm. C. Corrected emission spectra obtained with excitation at 340 nm (curve 1) and 390 nm (curve 2). D. Variation of polarization in the emission band with constant excitation at 340 nm. From Chen [21].

