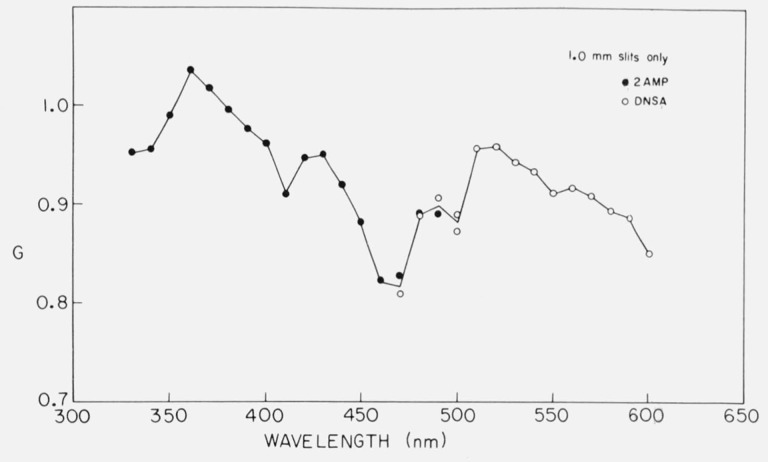
Figure 8.
Dependence of the grating factor, G, with emission setting; i.e., calibration curve for G. The samples used were 10−4 M 2AMP in 0.1 N H2SO4 excited at 285 nm, and 10−3 M DNSA (1-dimethylaminonaphthalene-5-sulfonamide) in 50 percent ethanol, excited at 330 nm. G was calculated from IHV/IHH. From Chen [52].

