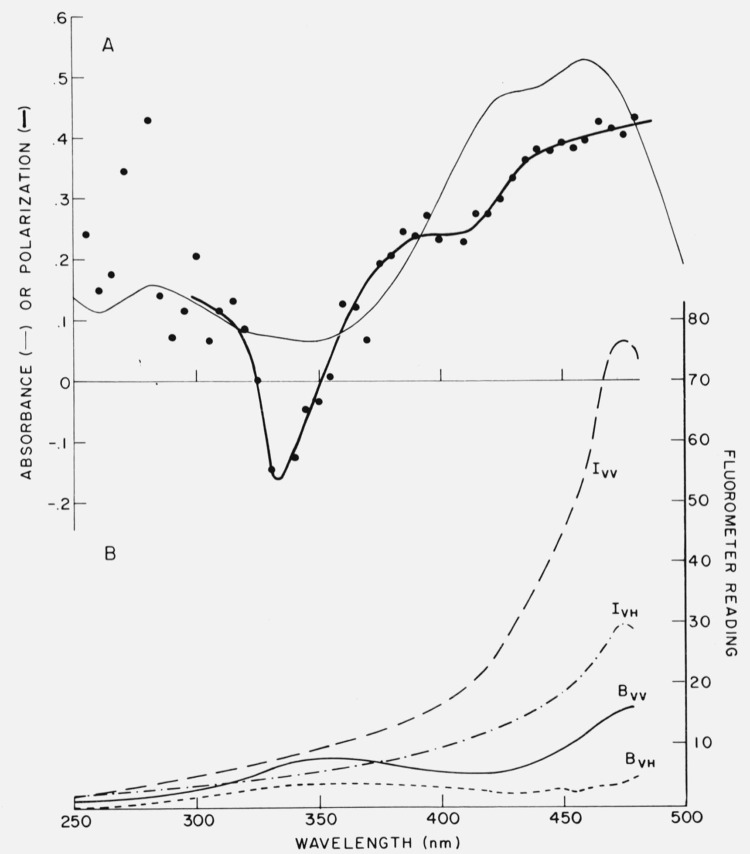
Figure 9.
Example showing significance of blanks in polarization measurements. In A are shown the absorption (light line) and polarization spectrum (heavy line and points) of bilirubin bound to rabbit serum albumin. The polarization was calculated, using G = 0.960, from the data of Part B, which gives the apparent excitation spectra of the sample (I) and blank (B). Subscripts refer to orientation of the polarizer and analyzer. The emission was monitored at 520 nm. From Chen [52].

