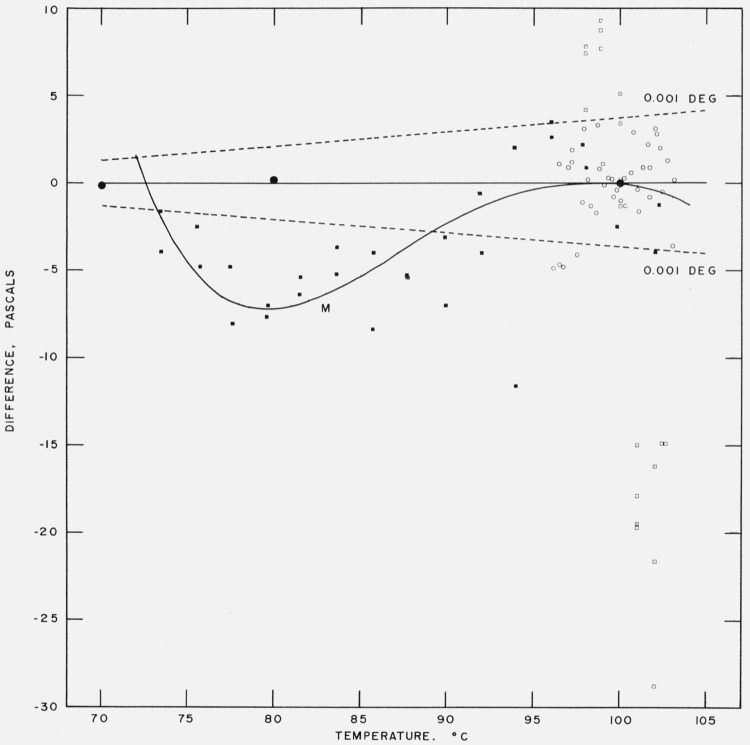
Figure 3. Comparison with experimental data at and below the steam point.
Vapor pressure difference [measurement – eq (17)] in pascals between measurement and eq (17).
● Stimson
■ Moser and Zmaczynski
○ Beattie and Blaisdell
□ Michels, Blaisse, Ten Seldam and Wouters
M Moser and Zmaczynski equation
Dashed lines are difference curves for a temperature deviation of ± 0.001 deg.

