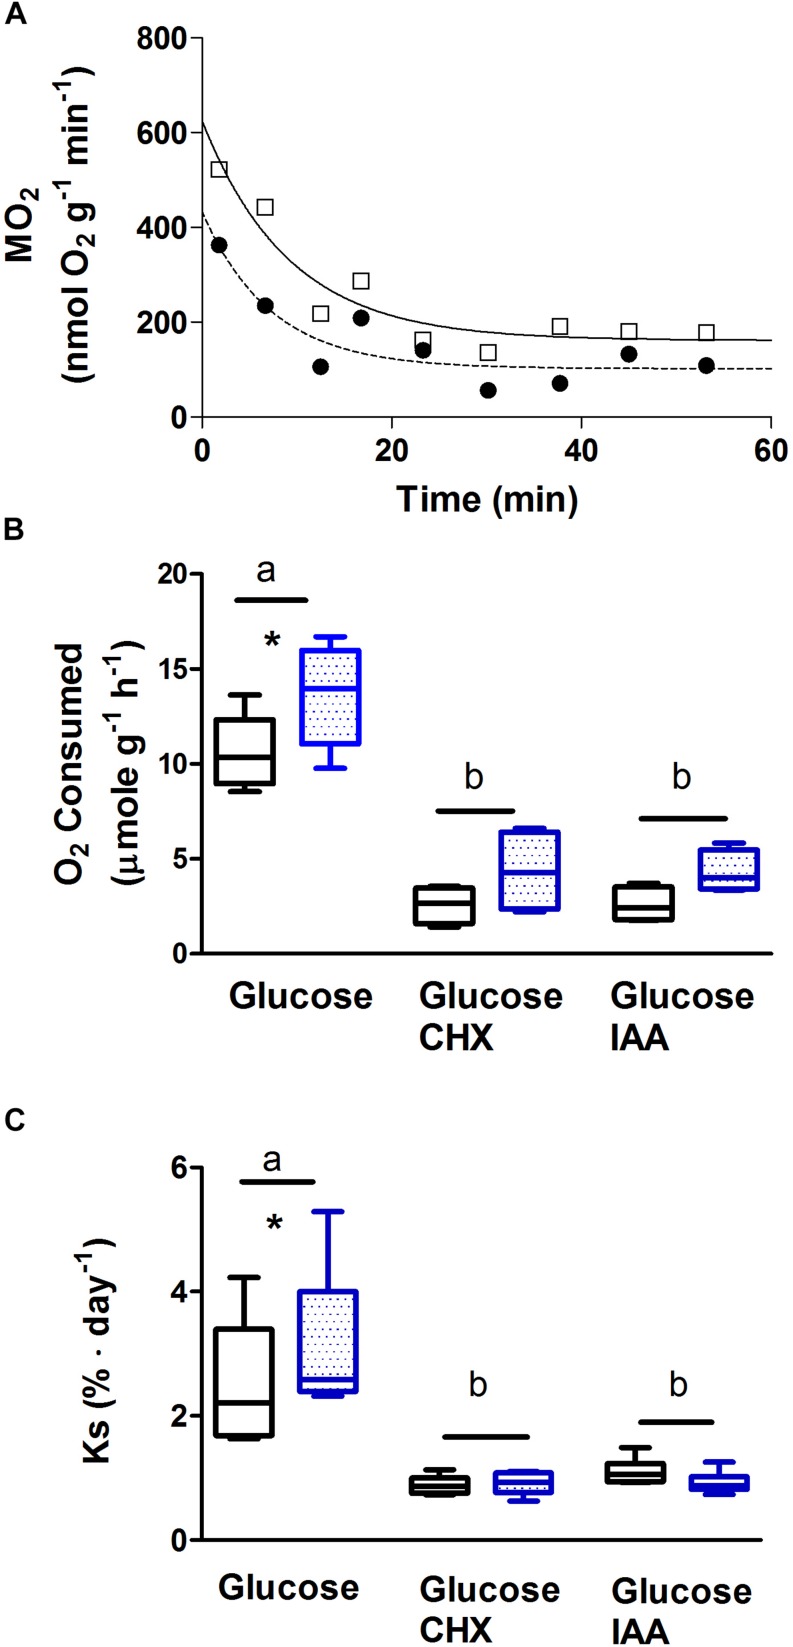
FIGURE 3.
Rate of oxygen consumption and protein synthesis by isolated mantle muscle strips from cuttlefish (Sepia officinalis). One of two paired mantle strips was stimulated to contract for 30 s at 3 Hz simulating jetting behavior. Oxygen consumption and protein synthesis was then measured during the recovery period. (A) Representative trace of rate of oxygen consumption. The curve with squares and solid line represents oxygen consumption by a mantle preparation that had been forced to contract; the dashed line with circles is the matched unstimulated paired preparation. (B) Average rate of oxygen consumed over a 40–60 min period following contraction. (C) Rate of protein synthesis measured over a 1 h period following contraction. Open bars represent unstimulated preparations; stippled bars indicate preparations that were stimulated. Text below x-axis shows additions to media. For CHX and IAA additions, preparations were incubated for 10 min prior to stimulation, during stimulation, and throughout the post contraction incubation period. For ṀO2 measurements N = 7 for glucose; N = 4 for CHX and IAA. For protein synthesis N = 6 in all cases. Values with different letters are significantly different. ∗Significant difference between unstimulated and stimulated preparations. Box and whisker plots show the range and median value.

