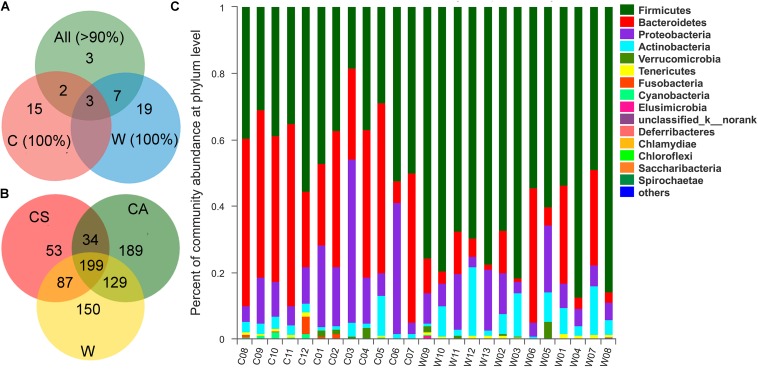
FIGURE 1.
(A) Veen diagrams show the number of shared and unique core Operational taxonomic units (OTUs) among the core OTUs of all samples (>90%), the core OTUs of wild samples (100%), and the core OTUs of captive samples (100%). (B) Veen diagrams show the number of shared and unique OTUs among CS, CA, and W groups. (C) Community bar plot analysis of bacterial at the phylum level.

