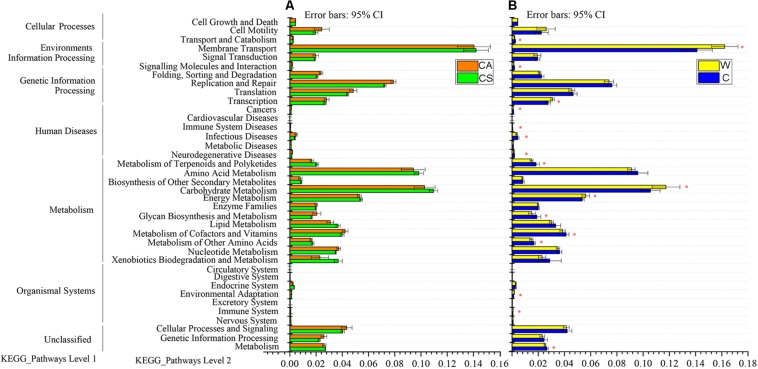
FIGURE 3.
Relative abundances of predicted genes in the metagenome related to level-1 and level-2 KEGG pathways; (A) red boxes, CS (summer) group; green boxes, CA (autumn) group; (B) yellow boxes, W (wild frogs) group; blue boxes, C (captive frogs) group. Asterisks indicate significant differences between groups.

