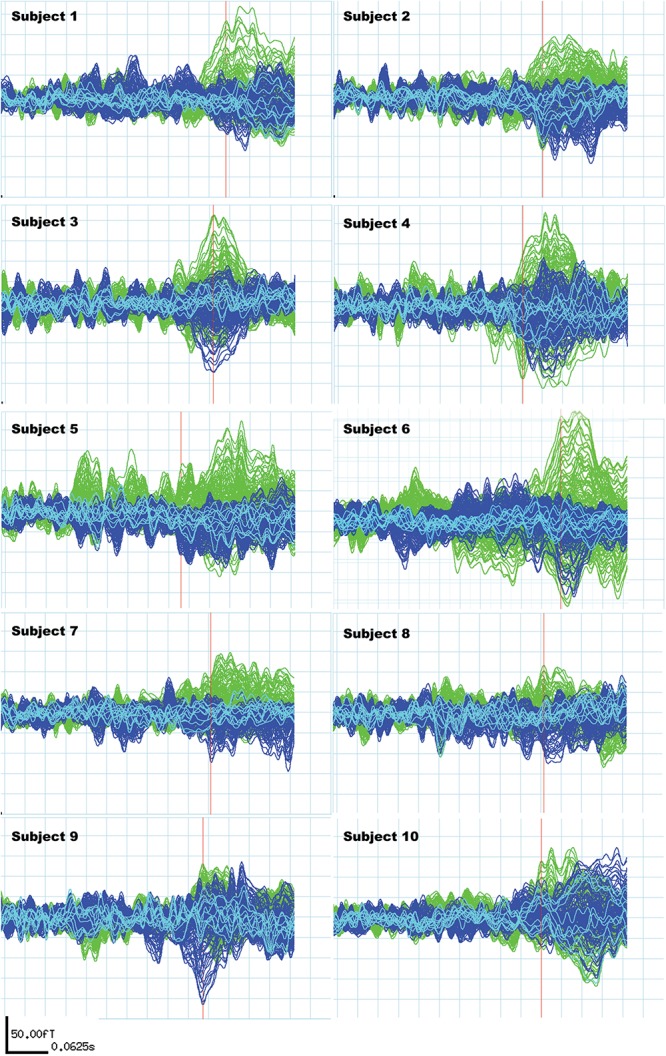
FIGURE 2.

Individual N400m signals of all 10 subjects. These signals are subtractions of the “unrelated” condition average from the “related” condition average to reflect the difference in N400m response only. The green signals represent activities recorded from the left hemisphere and the blue signals represent activities recorded from the right hemisphere. Light blue signals derive from midline sensors. The red bar locates the time point used to measure N400m latency and amplitude, which is the first peak within the N400m time window (300–500 ms) with a signal-to-noise ratio higher than 1.5 for each subject.
