FIGURE 1.

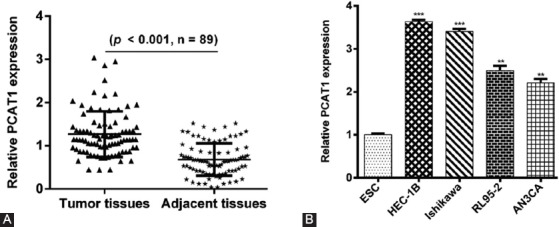
Prostate cancer-associated transcript 1 (PCAT1) was overexpressed in endometrial carcinoma (EC) tissues and cell lines. (A) The relative expression levels of PCAT1 in 89 EC tissues and paired adjacent tissues using reverse transcription quantitative PCR (RT-qPCR) analysis. (B) The relative expression levels of PCAT1 in EC cell lines (HEC-1B, Ishikawa, RL95-2, and AN3CA) and normal endometrial stromal cell line ESC using RT-qPCR analysis. Data are presented as mean ± standard deviation. **p < 0.01, ***p < 0.001.
