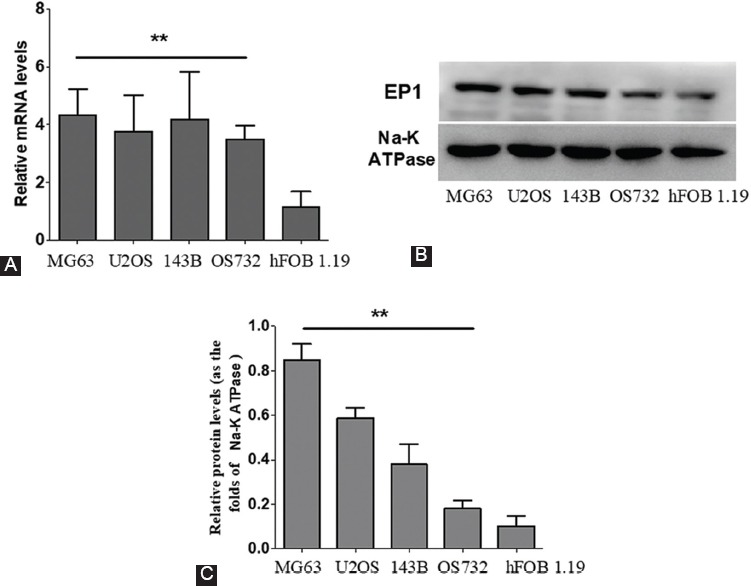
FIGURE 1.

EP1 levels in human osteosarcoma (OS) cell lines vs. human fetal osteoblastic hFOB 1.19 cells. Each sample was prepared in triplicate and the experiment was repeated three times. All bar graphs represent the mean ± SD. **p < 0.01 vs. hFOB 1.19. A) The mRNA levels of EP1 were significantly higher in MG63, U-2OS, 143B, and OS732 compared to hFOB 1.19 cells. B-C) Similarly, the protein levels of EP1 were significantly higher in MG63, U-2OS, 143B, and OS732 cell lines compared to hFOB 1.19.
