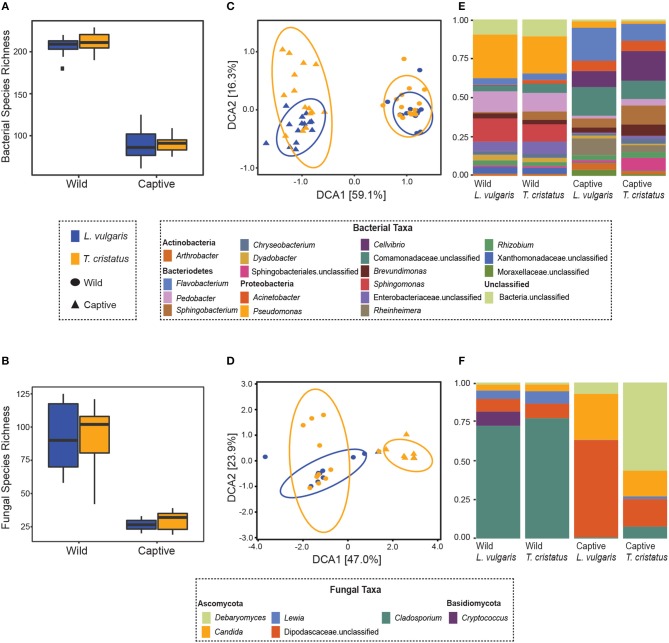
Figure 1.
Microbiome of animals in the wild and after 14 days in captivity. Boxplots displaying observed species richness in wild and captive Lissotriton vulgaris and Triturus cristatus for (A) bacteria (B) fungi. Boxes represent 25th and 75th percentile, the horizontal line is the median, whiskers are maximum and minimum values. Detrended correspondence analysis (DCA) plots of beta diversity in wild and captive L. vulgaris and T. cristatus for (C) bacteria (D) fungi. Ellipses indicate 95% confidence intervals. Where ellipses are absent, insufficient samples were present. Stacked bar plots of (E) bacterial taxa with relative abundance >1% and (F) fungal taxa with relative abundance >1%. Sample sizes bacteria: n = 15 (wild L. vulgaris), n = 15 (wild T. cristatus), n = 15 (captive L. vulgaris), n = 15 (captive T. cristatus). Sample sizes fungi: n = 10 (wild L. vulgaris), n = 11 (wild T. cristatus), n = 2 (captive L. vulgaris), n = 7 (captive T. cristatus).

