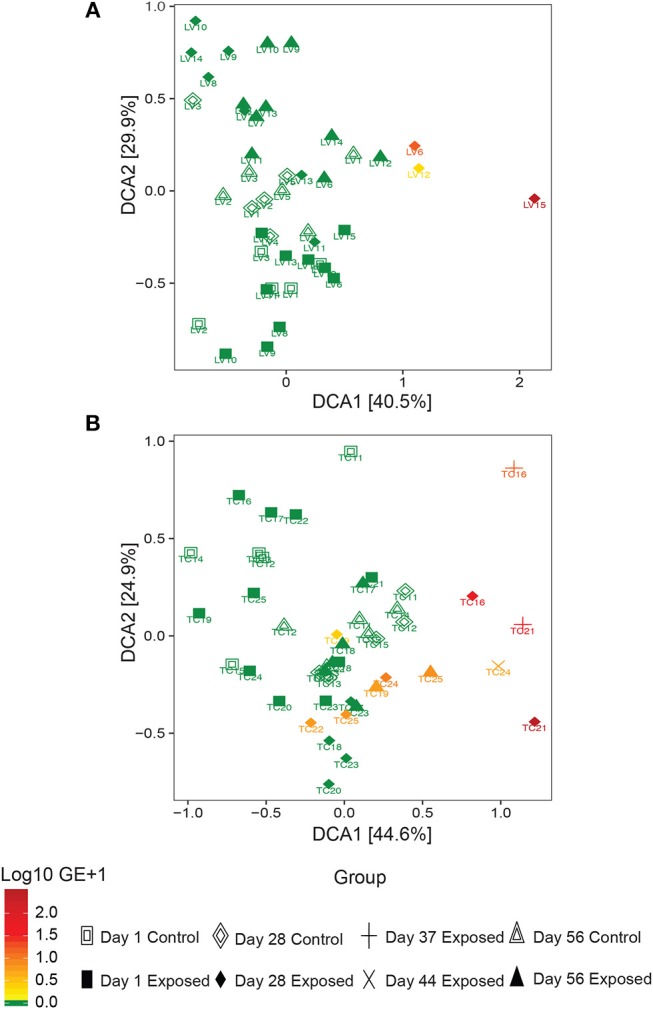
Figure 4.

Detrended correspondence analysis of beta diversity in the Bsal exposure experiment in (A) L. vulgaris, (B) T. cristatus. Each point is labeled with the individuals identity, shape is based on treatment group and day of sampling and color represents Bsal infection intensity (log10 GE+1). Initial sample sizes at day 1: n = 10 Bsal exposed T. cristatus, n = 10 Bsal exposed L. vulagris, n = 5 control T. cristatus, n = 5 control L. vulgaris.
