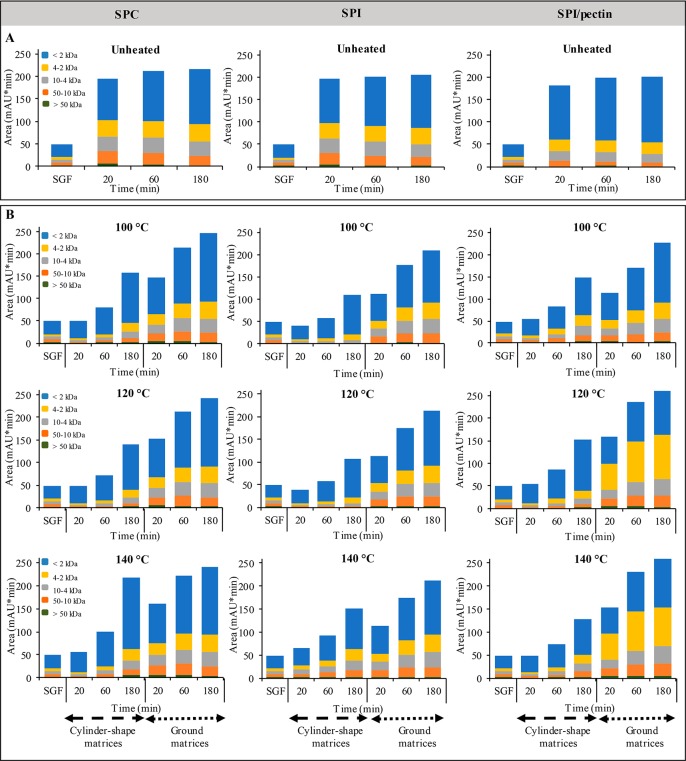
Figure 6.
Peak area (mAU*min) of peptides distribution after 20, 60, and 180 min of gastric digestion of unheated SPC, SPI, SPI/pectin ingredients (A) and protein-based matrices processed at different temperatures (cylinder-shape and ground matrices) (B). SGF: simulated gastric fluid. Results are shown as mean values (two independent samples, measured in duplicate). The mean values, standard deviations, and statistics results are shown in Tables 1 and 2 in the Supporting Information.

