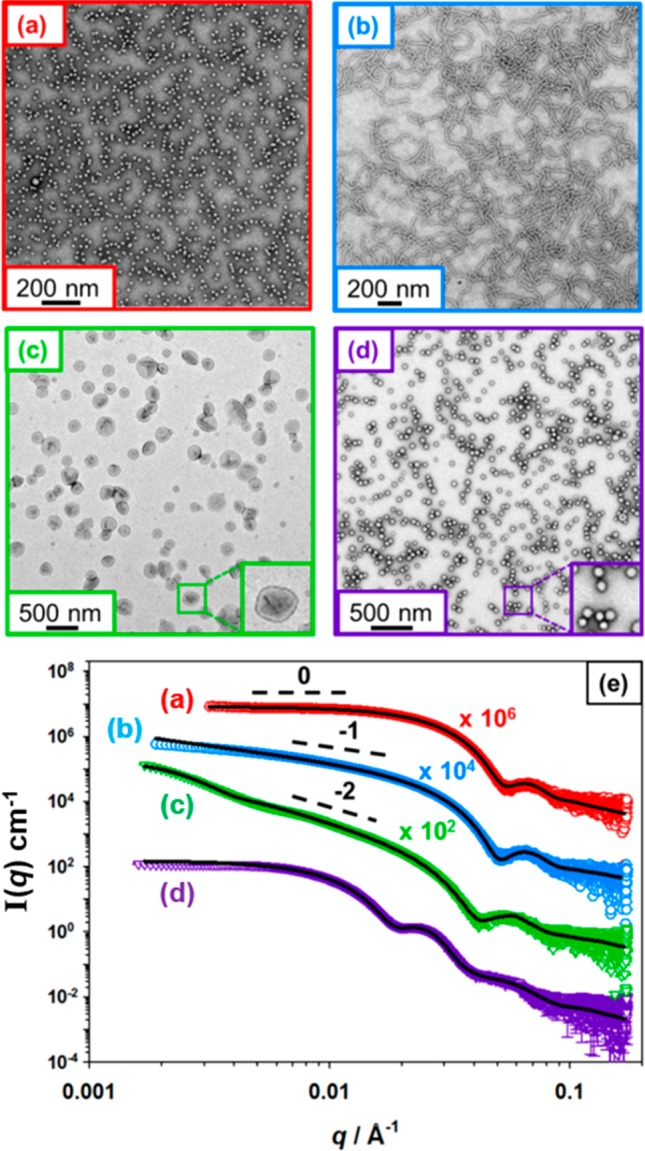
Figure 4.

TEM images obtained for (a) PGMA29-PMOEMA38 spheres, (b) PGMA29-PMOEMA43 worms, (c) relatively large PGMA29-PMOEMA70 vesicles and (d) relatively small PGMA29-PMOEMA84 vesicles. (e) Corresponding SAXS patterns recorded at 1.0% w/w for the same four copolymer dispersions, which were each originally prepared at 10% w/w. Black solid lines show the data fits obtained for each SAXS pattern using an appropriate spherical micelle, worm-like micelle or vesicle model. Each low q gradient is consistent with the TEM images.
