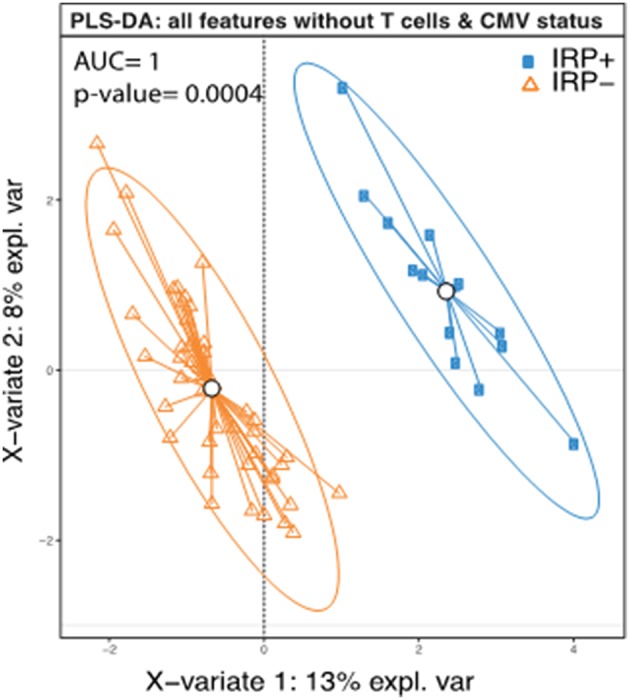
Figure 1.

Complete separation of IRP+ and IRP– groups indicate contributions from both clinical and immune factors aside from those used to define IRP. PLS-DA plot of IRP+ and IRP– patients using the collected immune data except those that were used to determine IRP (CMV status, CD4 and CD8, and CD8+ senescent (28CD–/CD57+) cells. Each dot on the plot represents a subject, where blue represents IRP+ samples and orange represents IRP– samples. Confidence ellipses for each group were plotted to highlight the strength of the discrimination (confidence level set to 95%). Groups centroids were represented in the center of each group with circles.
