Figure 7.
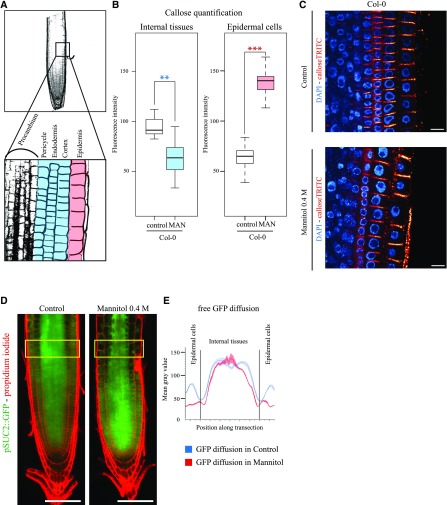
Callose and plasmodesmata trafficking is modulated upon mannitol treatment. A, Square indicates the region where the callose quantification was done (top). High magnification of region similar to A top square with the different cell layers (bottom). Epidermal cells are colored in red, and “internal layers” are colored in blue. The same color code has been conserved in the box plot representation to facilitate the comprehension of the figure. B, Callose level quantifications; upon mannitol treatment (3 h, 0.4 m mannitol), callose levels are down-regulated in internal layers (blue) of the root while being up-regulated in the epidermis (red). C, Representative confocal images of callose immunofluorescence (red) in wild-type Col-0 Arabidopsis roots in control and mannitol treatment. DAPI staining of DNA (blue) was performed to highlight the cellular organization of root tissues. Scale bars, 10 μm. n = 2 experiments, 10 roots/experiments, 5 to 10 cell wall/cell lineage/roots. Two-tailed Wilcoxon statistical analysis, *P < 0.05; **P < 0.01; ***P < 0.001. D, Arabidopsis seedlings expressing pSUC2::GFP in under control and mannitol treatment (16 h, 0.4 m mannitol). Scale bars, 50 μm. E, GFP symplastic unloading from the phloem to surrounding tissues is modified under mannitol treatment. We observed a reduction of GFP diffusion in epidermal cells, which showed increased callose levels at plasmodesmata. n = 3.

