Figure 2.
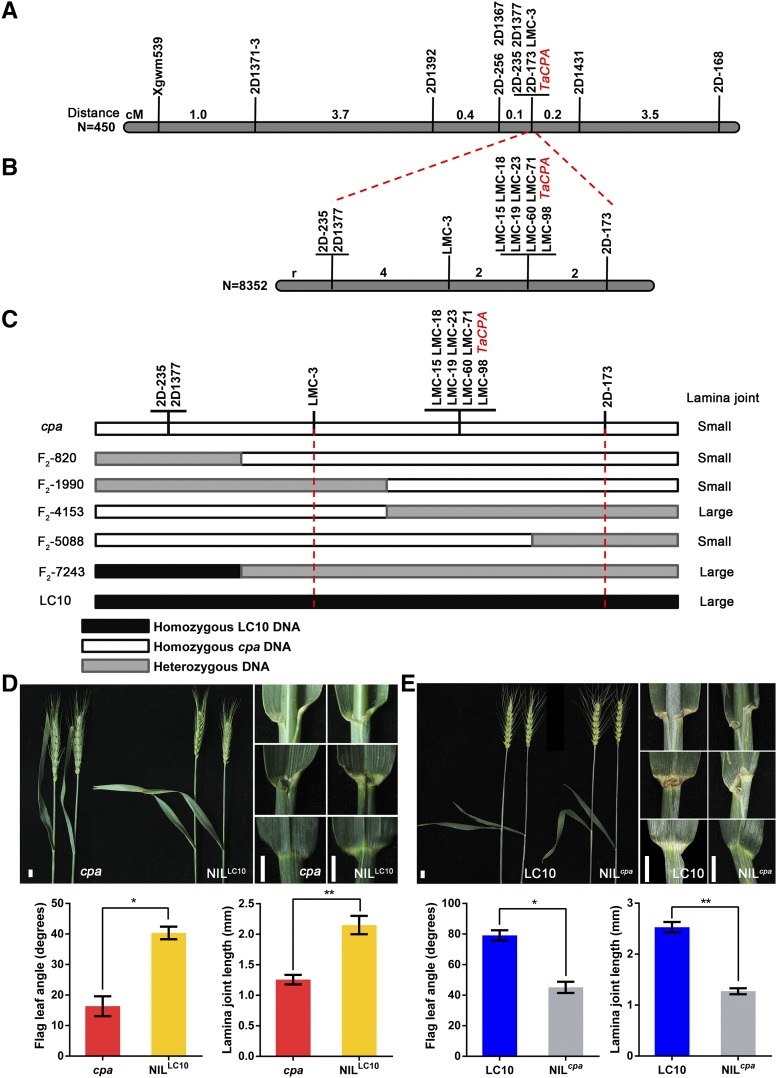
Fine mapping of the TaCPA locus and complementation test using NILs. A, Coarse linkage map of TaCPA on chromosome 2D. Numbers indicate the genetic distance between the adjacent markers. Thick black line indicates partial region of 2D chromosome. B, High-resolution linkage map of TaCPA. The number of recombinants (labeled as “r”) between the molecular markers and TaCPA is indicated. Thick black line indicates partial region of 2D chromosome. C, Fine mapping of TaCPA. Genotypes and phenotypes of recombinants of five F2 plants including (F2-820, F2-1990, F2-4153, F2-5088, and F2-7243) are reported. The name and phenotype of F2 individual plants were labeled in the left and right parts, respectively. Black and white blocks indicate genomic region from LC10 and cpa, respectively. Gray blocks indicate the heterozygous region. D and E, Phenotype of the flag leaf angle and lamina joint in cpa and NILLC10 (D) and NILcpa (E) plants. Bars = 1 cm. Single and double asterisks represent statistically significant differences determined by the two-tailed Student’s t test at P < 0.05 and P < 0.01, respectively. Error bars = sd (n = 10).

