Figure 6.
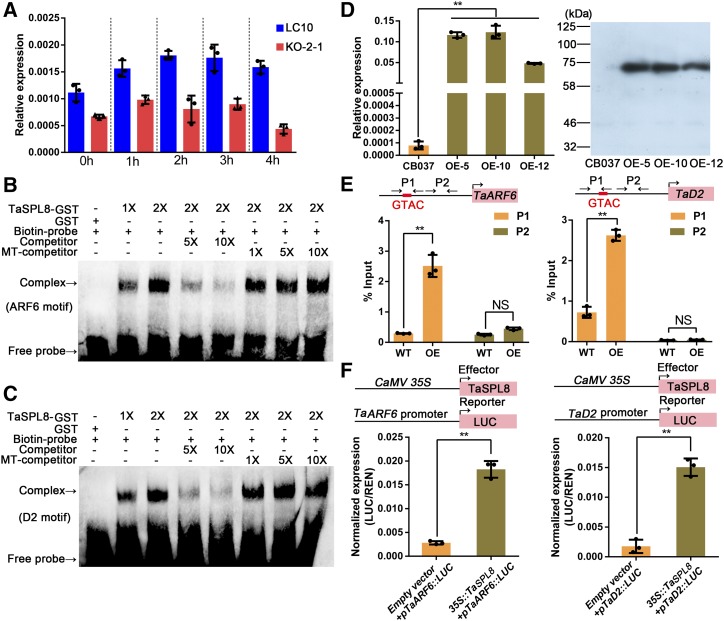
TaSPL8 binds and activates TaARF6 and TaD2. A, TaARF expression analysis after auxin treatment (10−4 mol/L) in the wild-type LC10 plant and a TaSPL8 mutant (KO-2-1). Each bar in the graph corresponds to the mean value of three data points, shown by dots. B and C, EMSAs to assess the TaSPL8 binding to the promoter region of TaARF6 (B) and TaD2 (C) containing the GTAC motif. The symbols “+” and “−” indicate the presence and absence, respectively, of corresponding probes, proteins, or competitors. The terms “1X” and “2X” indicate amounts of protein in the reaction. The terms “5X” and “10X” indicate 5- and 10-fold molar excess, respectively, of competitor or mutated competitor (MT) probes relative to biotin-labeled probes. D, Generation of wheat transgenic lines overexpressing TaSPL8-Myc chimeric protein (overexpressing [OE] lines) in the CB037 genetic background. The level of TaSPL8 transcripts (left) and TaSPL8-Myc protein (right) were measured. RT-qPCR data were normalized to wheat TaACTIN and each bar in the graph corresponds to the mean value of three data points, shown by dots. Double asterisks represent statistically significant differences determined by the two-tailed Student’s t test at **P < 0.01. E, ChIP assays to detect TaSPL8 binding of TaARF6 and TaD2 in vivo. Arrows indicate the position (P1 and P2) of primer combinations used in qPCR after ChIP assays. “P1” indicates the region where GTAC is located and “P2” indicates the region without GTAC with more than 400-bp distance from P1. Each bar in the graph corresponds to the mean value of three data points, shown by dots. Double asterisks represent statistically significant differences determined by the two-tailed Student’s t test at **P < 0.01. WT, wild type. F, Transactivation assays with tobacco leaves infiltrated with different combinations of effector and reporter constructs. Individual values (black dots) and means (bars) of three independent biological replicates are shown. The double asterisks represent significant differences determined by the two-tailed Student’s t test at **P < 0.01. LUC/REN (Renilla luciferase) indicates the ratio of the firefly luciferase activity and the renilla reniformis activity.

