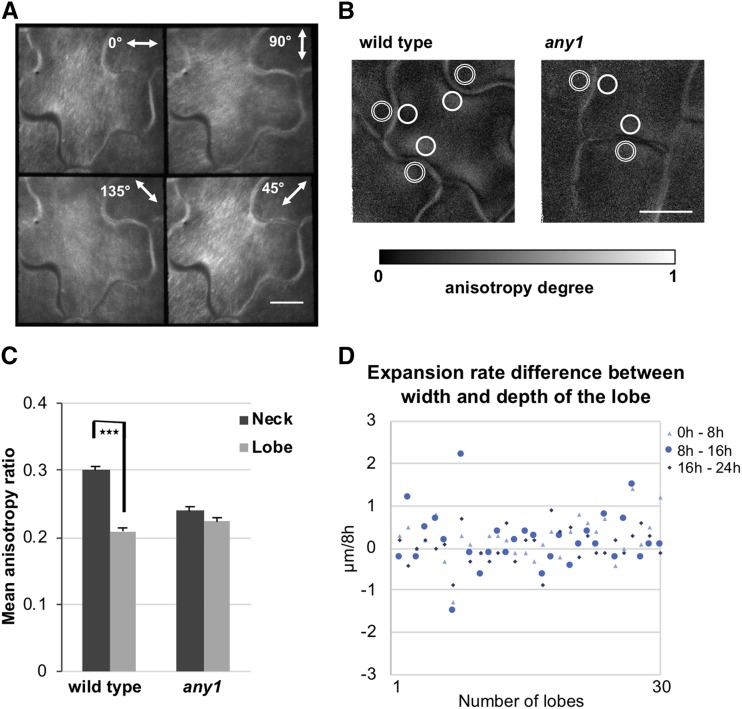
Figure 2.
Cellulose alignment at the periclinal wall of wild-type and any1 pavement cells. A, Fluorescence polarization at four different angles of cellulose microfibrils stained with S4B at 3 d after germination of wild-type pavement cells. B, Anisotropy degree of cellulose microfibrils represented by the pixel intensity at 1 d after germination of wild-type and any1 cells. Double-lined circles (lobe regions) and solid-lined circles (neck regions) indicate examples of regions of interest used for the graph in (C). Scale bars = 10 μm. C, Anisotropy of cellulose alignment at the neck and the corresponding lobe regions of the wild type and any1 mutant at 1 d after germination measured based on the signal intensity of each pixel at different emission angles. Error bars = se. Asterisks indicate statistically significant differences (P < 0.001, paired t test). n = 54 necks and adjacent lobes of the same undulation. All necks from two or three cells taken from 13 and 16 seedlings for wild type and any1, respectively, were used in this analysis. D, Difference in the expansion rates between the width and the depth of the lobe at the early stages of lobe formation in the wild type. The same lobe was monitored over 24 h at 8 h intervals. The difference in expansion rates between the width and the depth of the lobe was calculated as (widthth – widthth-8h) – (depthth – depthth-8h). n = 30 lobes. All lobes from two cells from three different seedlings were used in the analysis.

