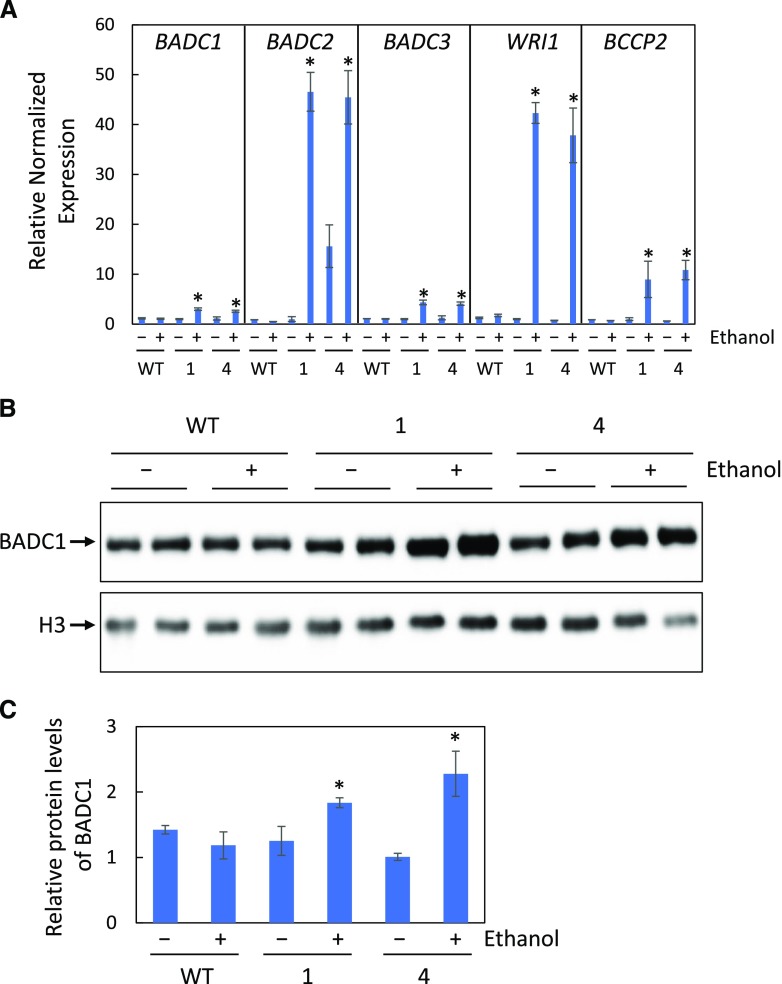
Figure 5.
BADC expression and BADC1 protein levels are elevated in inducible WRI1 transgenic plants. A, Relative gene expression of BADCs, BCCP2, and WRI1 in siliques (7 d after flowering) of wild-type (WT) or two independent ethanol inducible WRI1 transgenic lines (AlcA:WRI1 line 1 and line 4) treated (+) or not treated (−) with 2% ethanol for 4 d. B, BADC1 protein levels. C, Relative BADC1 protein levels in B, quantified with GelAnalyzer2010 and normalized against corresponding protein levels of histone H3. Asterisks denote statistically significant difference from the wild type (*P < 0.05; Student's t test). Data in this figure are representative of three independent repetitions.

