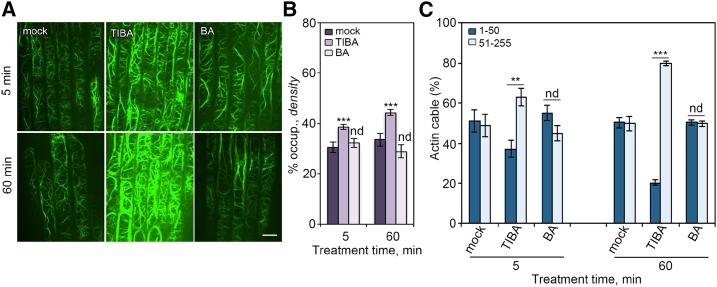
Figure 1.
Cortical actin array rearranges in response to TIBA treatment. A, Representative images of the cortical actin array in epidermal cell from root tips. Five-day-old Arabidopsis seedlings were treated with 10 µm TIBA or 50 µm benzoic acid (BA) for indicated times. Bar = 10 µm. B and C, Actin architecture was measured on images shown in A. B, Percentage of occupancy, or density, is a measure of the abundance of actin filaments in the cortical array. C, Quantification of the fluorescence intensity of actin cables. We measured the peaks of the fluorescence profile along a line drawn across actin cables and subtracted the background value. For ease of comparison, populations of fluorescence intensities that were lower than 50 and higher than 50 were binned. Values given are means ± se (n > 300 images from 25 seedlings for each treatment; **P < 0.01; ***P < 0.001; nd, no significant difference between mock and treatment; t test; Pearson’s χ2 test was applied to evaluate significant differences in the frequency distribution across intensity classes between mock and treatment).

