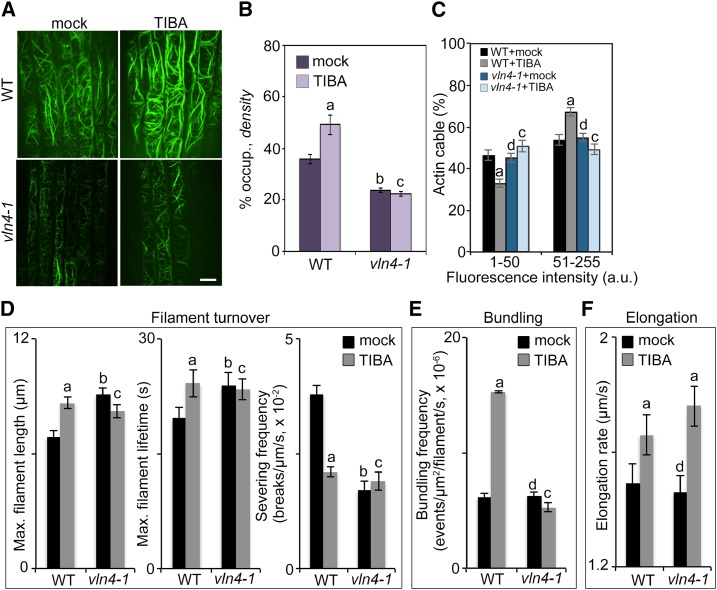
Figure 3.
Loss of VLN4 in cells leads to impaired actin responses to TIBA treatment. A, Representative images of root epidermal cells from wild-type (WT) and vln4-1 mutant expressing GFP-fABD2 after treatment with mock or 10 µm TIBA for 5 min. Bar = 10 µm. B and C, Actin architecture analyses were performed on images shown in A. D to F, Individual filament dynamics were measured on wild-type and vln4-1 mutant seedlings treated with mock or 10 µm TIBA for 5 min. See also Supplemental Table S1 for full analyses of single-filament parameters. Values given are means ± se (for actin architecture analysis, n > 300 images from 25 seedlings for each genotype and treatment; for single-filament analysis, n > 50 filaments from 10 seedlings for each genotype and treatment; a, significantly different from mock control within the same genotype; b, significantly different from wild-type treated with mock; c, no significant difference from mock control within the same genotype; d, no significant difference from wild-type treated with mock; t test; Pearson’s χ2 test was applied to evaluate significant differences in the frequency distribution across intensity classes between genotypes and treatments).

