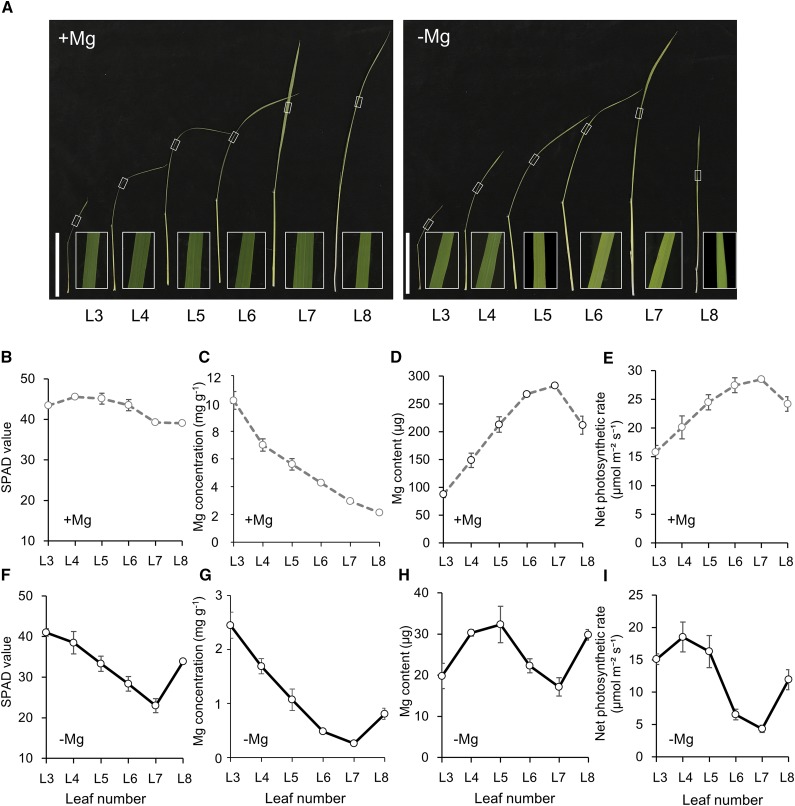
Figure 1.
Physiological responses to −Mg stress among rice leaves. A, Growth and chlorosis phenotypes in different leaves. White frame photo is magnified section of each leaf blade. Scale bars = 10 cm. B to I, SPAD values (B and F), Mg concentration (C and G), Mg content (D and H), and net photosynthetic rate (E and I) under +Mg (B−E) or −Mg (F–I) conditions. Rice seedlings were grown in nutrient solution containing 0- or 250-μm Mg for 8 d. The SPAD value of each leaf was determined using a chlorophyll meter. Mg was determined by inductively coupled plasma-mass spectrometry (ICP-MS). Net photosynthetic rates were measured using a portable photosynthesis analysis system. L3–L8 are labels for leaves ordered from old to young.

