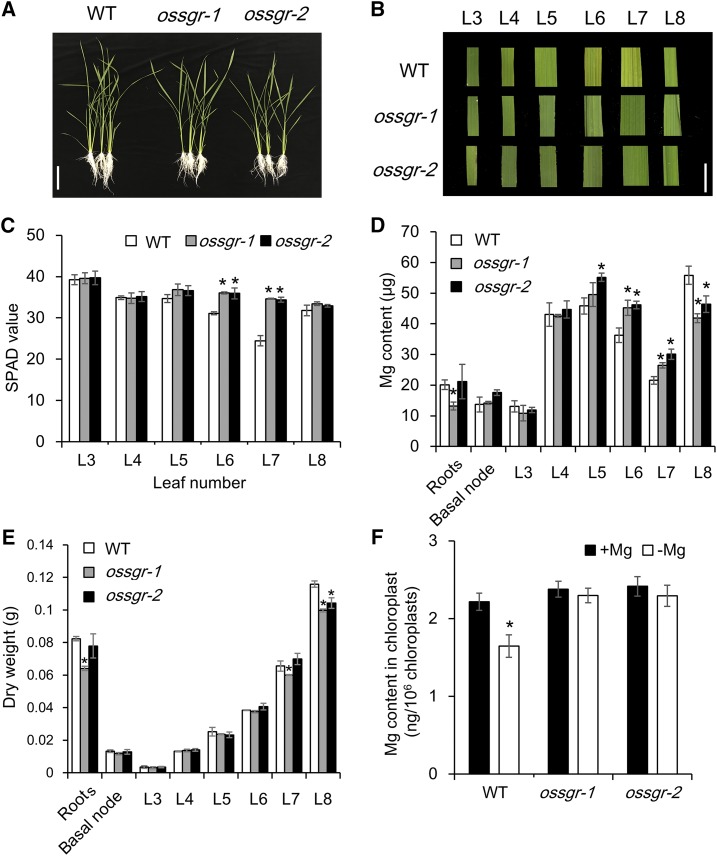
Figure 4.
Phenotypes and Mg accumulation in ossgr mutants under −Mg stress. A and B, Growth (A) and chlorosis phenotypes (B) in different leaves of wild-type (WT) and mutant plants. Images in (B) are digitally abstracted and shown as a composite for comparison. Scale bars = 10 cm (A) and 1 cm(B). C, SPAD value. D, Mg content. E, Dry weight. F, Mg content in chloroplasts. Both wild-type and mutant rice seedlings were grown in a nutrient solution containing 0- or 250-μm Mg for 8 d. The SPAD value of each leaf was measured using a chlorophyll meter. Intact chloroplasts from wild-type and mutant plants were obtained using the Percoll gradient method. Mg content was determined by ICP-MS. L3–L8 are labels for leaves ordered from old to young. Data are means ± sd (n = 3). The asterisk shows a significant difference compared to wild type (P < 0.05 by Tukey’s test).

