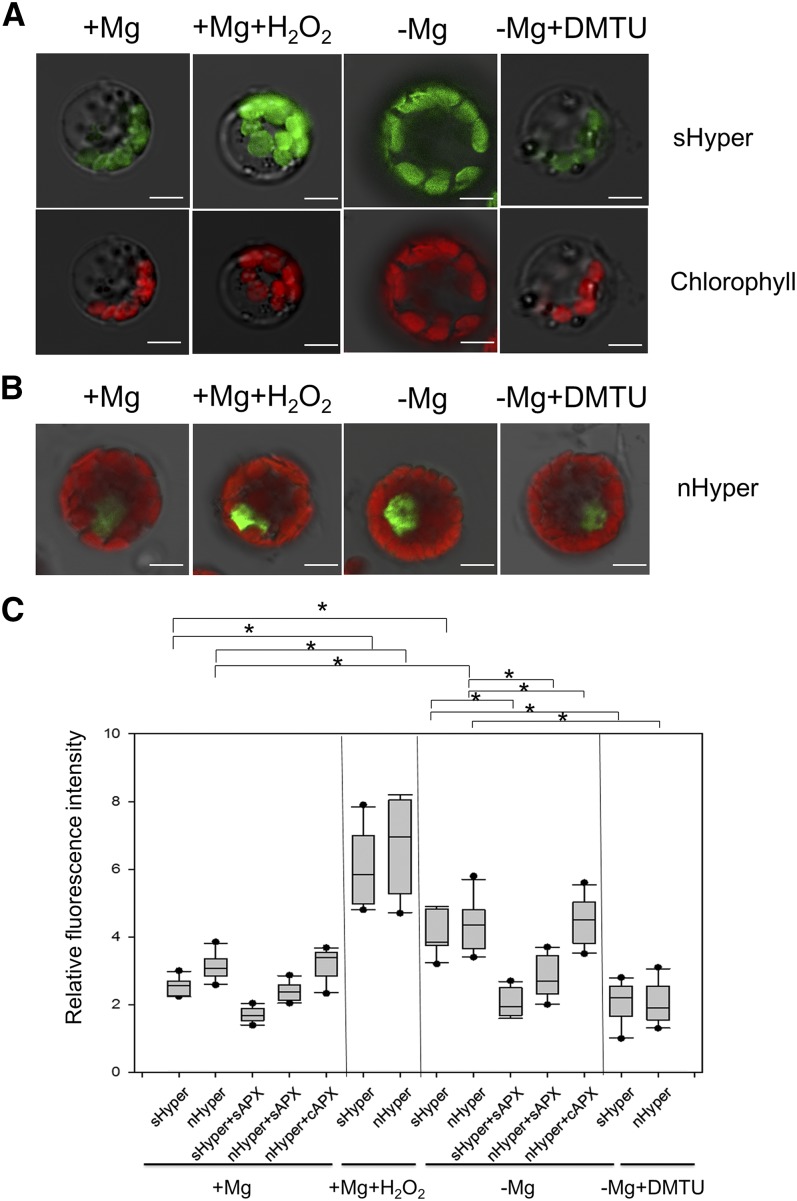
Figure 8.
Production of chloroplastic and nuclear H2O2 by −Mg. A and B, Responses of the stroma or nuclear targeted Hyper in rice protoplasts to oxidized state (5-mm H2O2 for 10 min) or reduced state (100-μm DMTU for 20 min) under Mg-sufficient (+) and -deficient (−) conditions. Scale bars = 5 μm. C, Fluorescence intensity of Hyper relative to chlorophyll autofluorescence. Box-whisker plots show signal variations in protoplasts (n = 10). The asterisk shows a significant difference (P < 0.05 by Tukey’s test).

