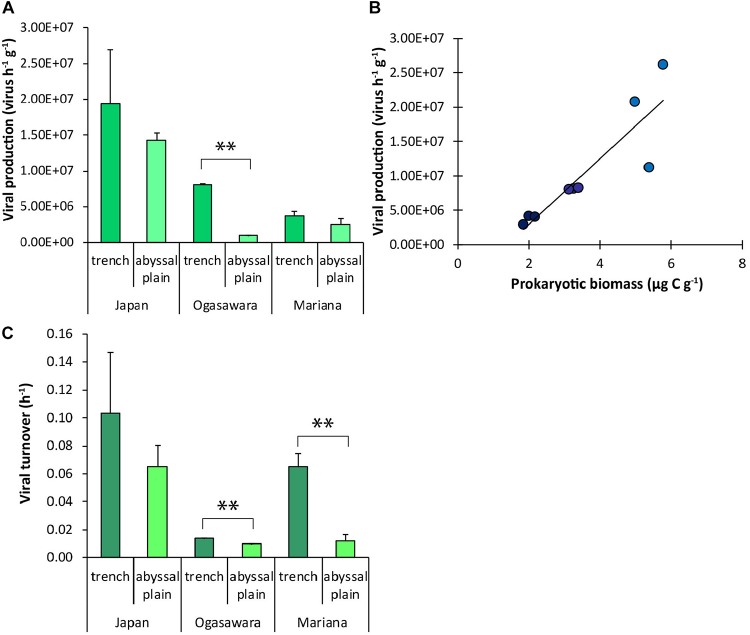
FIGURE 5.
(A) Viral production. (B) Relationship between prokaryotic biomass and viral production values in each hadal trench. The equation of the fitting line is: Y = 5 × 10⁶ X – 6 × 10⁶; R = 0.89; n = 9; p < 0.01. Dark blue dots: Mariana Trench; blue dots: Izu-Ogasawara Trench; light blue dots: Japan Trench. (C) Viral turnover rate. In (A,C), reported are the mean values and related SDs for each hadal trench site and related abyssal site. Statistical significance is tested between hadal trench sediments and abyssal sites. ∗∗p < 0.01.

