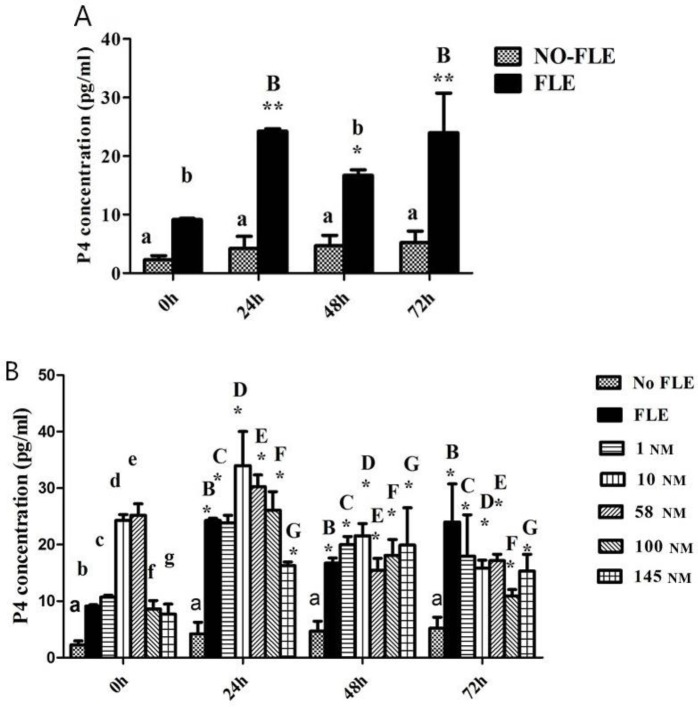
Fig. 2.
P4 concentration. A: Identification of corpus luteum granulosa. A and a indicate significant difference, and B and b indicate significant difference. B: P4 concentrations were influenced by concentrations of Orexin A and different time. The same letter with different case indicates significant difference compared with the P4 concentration expression in no-FLE group at 0 h (P<0.05). * indicates significant difference compared with the P4 concentration expression in no-FLE group at 0, 24, 48, and 72 h (P<0.05)

