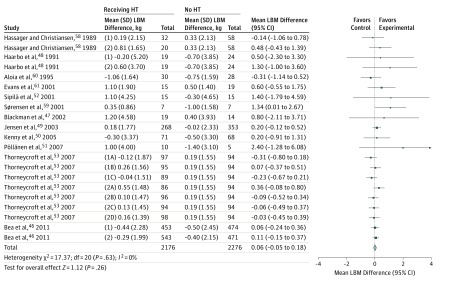
Figure 2. Summary Meta-analysis of the Association Between Hormone Therapy (HT) Intervention and Muscle Mass Outcomes .
The forest plot of the overall meta-analyses of all included studies presents the mean (95% CI) differences for lean body mass between women receiving HT and women not receiving HT. Size of data marker indicates relative weighting of study.

