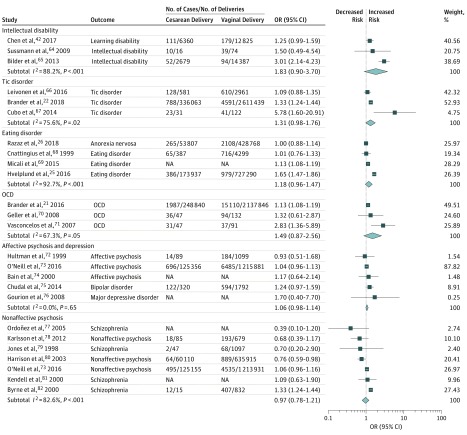
Figure 3. Forest Plot of the Results of Random-Effects Meta-analyses Stratified by Intellectual Disability, Tic Disorder, Eating Disorder, Obsessive-Compulsive Disorder (OCD), Affective Psychosis/Depression, and Nonaffective Psychosis.
Forest plot of odds ratios (ORs) in studies investigating the associations between cesarean delivery and each outcome. Diamonds show overall pooled estimate for each outcome. NA indicates not available.

